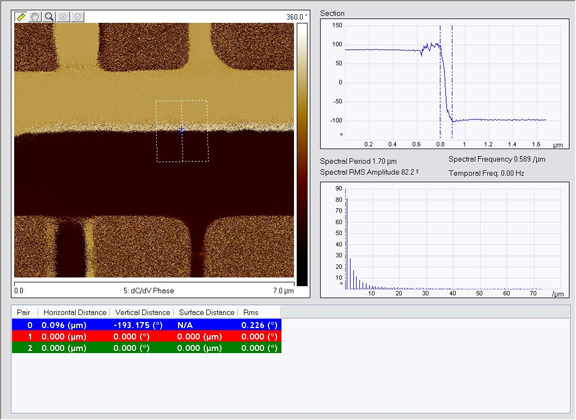
Figure 1 through Figure 3 show open loop dC/dV Phase SCM scans and cross-sections of the standard SCM SRAM standard sample with Dark Lift Enabled (laser Off) or Disabled (laser On) at several AC bias levels. Note that width of the depletion region, shown by the cross-section, depends on the laser light as well as the AC bias. It is important to use a small AC bias to avoid saturating the sensor.
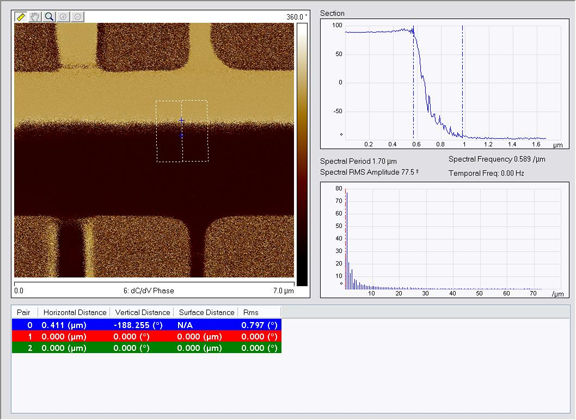
Figure 1: Cross sections (right) of a SCM scan (left) of a SRAM sample with 250mV AC bias. Laser ON (top) and laser OFF (bottom)
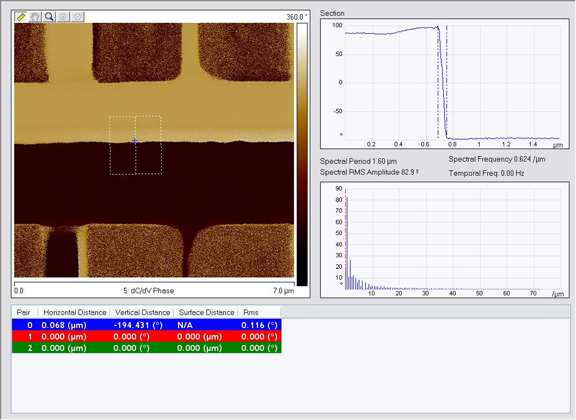
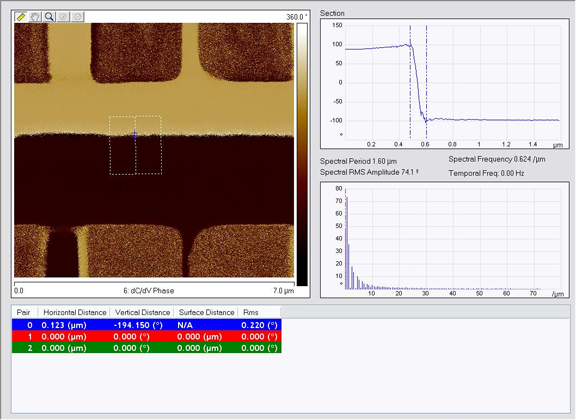
Figure 2: Cross sections (right) of a SCM scan (left) of a SRAM sample with 500mV AC bias. Laser ON (top) and laser OFF (bottom)
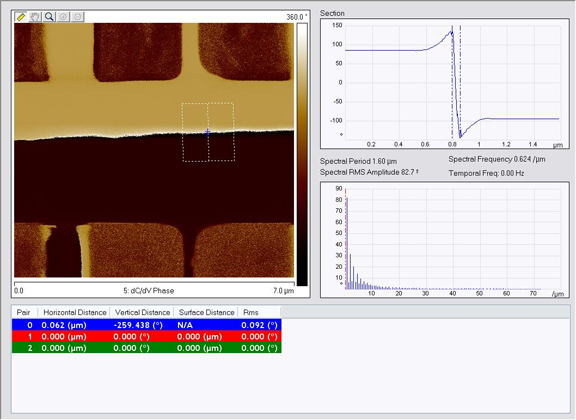
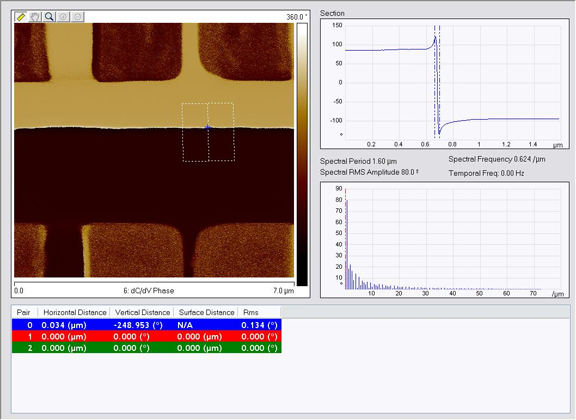
Figure 3: Cross sections (right) of a SCM scan (left) of a SRAM sample with 1250mV AC bias. Laser ON (top) and laser OFF (bottom)
Figure 4 shows SSRM scans of the same standard SCM SRAM standard sample with Dark Lift Enabled (laser Off) or Disabled (laser On). Note that the resistance changes with illumination.
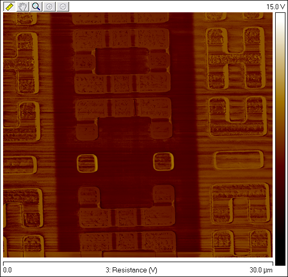
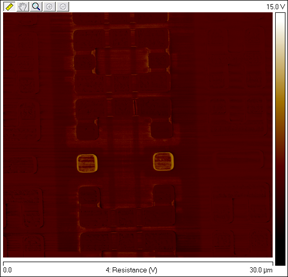
Figure 4: Scanning Spreading Resistance Microscopy of SRAM sample with laser ON (left) and Off (right). Sample bias -1V. Lighter areas have less resistance.
| www.bruker.com | Bruker Corporation |
| www.brukerafmprobes.com | 112 Robin Hill Rd. |
| nanoscaleworld.bruker-axs.com/nanoscaleworld/ | Santa Barbara, CA 93117 |
| Customer Support: (800) 873-9750 | |
| Copyright 2010, 2011. All Rights Reserved. |