 PeakForce TUNA Principles of Operation
PeakForce TUNA Principles of Operation
PeakForce TUNA Principles of Operation
Peak Force Tapping™ mode, the core technology behind PeakForce QNM™ and ScanAsyst™ modes, performs a very fast force curve at every pixel in the image. The peak interaction force of each of these force curves is then used as the imaging feedback signal. Peak Force Tapping mode modulates the Z-piezo at ~2 kHz (Icon, MultiMode. Catalyst operates at ~1 kHz) with a default Peak Force Amplitude of 150 nm (0–peak). Analysis of force curve data is done on the fly, providing a map of multiple mechanical properties that has the same resolution as the height image.
The Force vs. Time display, shown in Figure 1 is referred to as the “heartbeat.” When the tip is far from the surface (point A) there is little or no force on the tip. As the tip approaches the surface, the cantilever is pulled down toward the surface by attractive forces (usually van der Waals, electrostatic or capillary forces) as represented by the negative force (below the horizontal axis). At point B, the attractive forces overcome the cantilever stiffness and the tip is pulled to the surface. The tip then stays on the surface and the force increases until the Z position of the modulation reaches its bottom-most position at point C. This is where the peak force occurs. The peak force (force at point C) during the interaction period is kept constant by the system feedback. The probe then starts to withdraw and the force decreases until it reaches a minimum at point D. Adhesion is measured by the force at this point. The point where the tip comes off the surface is called the pull-off point; this often coincides with the minimum force. Once the tip has come off the surface, only long range forces affect the tip, so once again, the force is very small or zero when the tip-sample separation is at its maximum (point E).
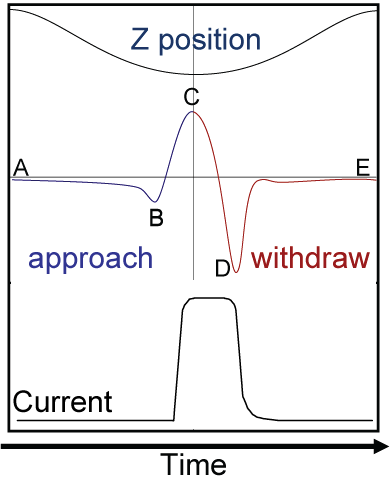
Figure 1: The “heartbeat.” Z position, Force and Current as a function of time during one Peak Force Tapping cycle. Blue indicates approach while red indicates retract.
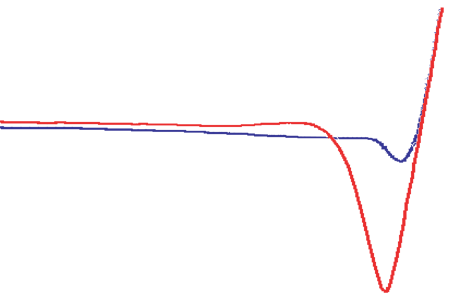
Using the Z-position information, the heartbeat is transformed into a force curve, shown in Figure 2. The force curve plot is analyzed, on the fly, to produce the peak interaction force as the control feedback signal and the mechanical properties of the sample (Adhesion, Modulus, Deformation, Dissipation).
From the current-time plot, the PeakForce TUNA algorithm extracts three measurements: 1) Peak Current, 2) TUNA Current, and 3) Contact Current.
Peak Current is the instantaneous current at point C, coinciding with Peak Force. It corresponds to the current measured at a defined force. Peak Current may be, but is not necessarily, the maximum current, since the limited rise time (imposed by the bandwidth of the TUNA module or the resistance-capacitance of the sample) may cause a lag in the current response.
TUNA Current is the average current over one full tapping cycle, from point A to point E. It includes both the current measured while tip is in contact with the surface and while it is off the surface.
Contact Current is the average current only when tip is in contact with the surface, from the snap-in at point B to the pull-off at point D.
The current-time plot usually has different characteristics than the force-time plot. It does not always have a peak (as does the force-time plot); current can reach a plateau after a certain force threshold. There is also an AC current component of the measurement, part of which is capacitive charging, which is removed from the output. The cause of the AC component is that the probe (including cantilever) and the sample essentially form a capacitor, with its capacitance modulated by the z-position of the probe. At a constant DC bias, charging/discharging current at the tapping frequency will occur. Again, this is considered parasitic, and removed as background. The dynamic change of the current (together with deflection) can be captured with NanoScope’s High-Speed Data Capture function at any time during scanning, and can later be analyzed and correlated (with force for instance).
| www.bruker.com | Bruker Corporation |
| www.brukerafmprobes.com | 112 Robin Hill Rd. |
| nanoscaleworld.bruker-axs.com/nanoscaleworld/ | Santa Barbara, CA 93117 |
| Customer Support: (800) 873-9750 | |
| Copyright 2010, 2011. All Rights Reserved. |