Contact AFM Mode produces the best understood force volume images. The forces encountered, both attractive and repulsive, include electrostatic, van der Waals, surface tension, capillary, ligand/receptor, and magnetic interactions. Alternative modes of force volume imaging (tapping, phase, etc.) are harder to interpret and are not discussed here.
A force volume procedure follows.
Select a sample and mount it on the AFM. Initially, the sample should be familiar enough to obtain a recognizable image easily (e.g. a silicon calibration reference). | |
![]() |
|
|
|
![]() |
After engaging the surface, adjust the Setpoint so the tip exerts minimal force on the sample. Reduce the Setpoint until the tip retracts, then raise it slowly until there is just enough tip-sample contact to obtain an image. Optimize the Channel 1 parameters for a good image: set Data Type to Height and Realtime Plane Fit to Line. The image collected by Channel 1 is displayed as the height image in the force volume display. |
If the sample is weakly adsorbed to the substrate or there is some other reason for minimal tip-sample contact before collecting the volume (i.e.: to avoid contamination of or damage to the tip), it is possible to collect force volume data skipping the contact image step. First, before engaging, set Image Scan > Scan Size to 0. Then engage normally, or false engage if it is absolutely necessary not to contact the surface. Once engaged, lower the Setpoint until the tip is retracted from the surface. The rest of the procedure is essentially the same. |
|
![]() |
To obtain a force plot of the surface, click the Ramp icon. Set the Ramp Rate to the recommended default of 4 Hz. (In fluid, higher rates can induce hydrodynamic forces on the tip.) Using the data scale from your image, set the Ramp size to a number larger than the roughness of your sample. |
![]() |
|
|
Figure 1: Calibrating Deflection as Displacement.
|
|
![]() |
|
|
|
![]() |
|
![]() |
To obtain a Force Volume image, click the Force Volume icon in the Workflow Toolbar. |
Figure 2: The Force Volume Interface
Figure 2 shows the following:
|
Figure 3: The Force Volume Parameter Windows
There are five Force Volume panels in the Force Volume Parameters window, shown in Figure 3, which control sampling and scanning for the force volume image and force curve. They are organized by function:
|
|
The Z Scan panel groups basic sampling and scanning parameters for the force volume image and force curve. The following parameters are often carried over from the force plot settings: Z scan start, Ramp size and Ramp Rate. The Display Mode parameter in the Z Scan panel can be set to display in the force plots region the Extend portion of the force curves, the Retract portion, or Both.
Remember that you are constructing a “map” of many separate force plots across the sample surface; therefore, there is a lot of data to sort. Depending upon settings, capturing a detailed force volume image can require hours. NOTE: While the size of the area imaged by the AFM is ultimately limited by the characteristics of the piezoelectric actuator, the resolution of the data is limited by the computer hardware and software. The total amount of data for any given force volume image file is limited to a maximum of 32 megabytes (MB) (16 M points). This places restrictions on the resolution of the force curves, and the force volume image.
There are three parameters in three distinct control panels in Force Volume Mode which affect the resolution of the data: Number of samples, Force per line and Samples per line. The Number of samples parameter in the Z Scan control panel sets the number of points collected in each force curve. This is the number of slices in the force volume image, that is, the Z resolution of the force volume image. This parameter does not affect the speed of the scan but does affect file size. A good default setting is 32. The Force per line parameter in the Force Volume control panel sets the number of force curves collected and stored along each scan line of the sample and significantly affects the scan speed. This parameter is, effectively, the XY resolution of the force volume image. A setting that sufficiently resolves force-defined features, yet minimizes collection time, is desirable. A good default value is 64. These two parameters are interdependent, due to the 32 MB limit: (Force per line)2 x (4 x Number of samples) < 32 MB The above requirements restrict the maximum number of force curves per line in the volume to 64. The Samples per line parameter in the Image Scan control panel sets the number of pixels in each scan line of the height image. NOTE: For each pixel in the height image, a force curve is collected. Increasing the value of Samples per line, therefore, increases the scanning time needed to collect the entire volume. This parameter directly affects the XY resolution of the height image only. A setting of 128 provides sufficient detail to resolve many small features while helping to reduce capture time.
When Samples per line is greater than Force per line, at each XY position in the height image, the NanoScope moves the probe toward the sample until the Trig Threshold is reached and then retracts - the same motion as a force curve. However only one force curve, the first one taken in a pixel’s area of the force volume image, is displayed in the force volume image. For example, with 512 Samples per line and Force per line set at 64, then there are 16 pixels (4x4) in the height image that correspond to one pixel in the force volume image. While the piezoelectric actuator and the tip go through the motions of a force curve at each of those sixteen pixels, only the first force curve is used in the force volume pixel. The size limit on the data file enforces a trade-off between XY resolution and Z resolution. To know whether a tip sticks to the surface at different locations, low Z resolution (Number of samples) in favor of high XY resolution (Samples per line and Force per line) is sufficient. If a detailed examination of the interaction forces between tip and sample is desired, then high Z resolution is needed. Saving the Scan Mode height image (step 1) can compensate for low XY resolution in the force volume image. Setting Number of samples, Force per line, and Samples per line to 16, 16, 512, respectively, are good starting values. Resolution and scan speed are the major determinants of the time required to collect a complete force volume image. Figure 4 illustrates the effect that Samples per line and Ramp rate parameters have on imaging time. The times were calculated assuming the maximum number of force curves per line (Force per line) for each Samples per line. |
Figure 4: Image Scan Time versus Samples per line and Ramp Rate .
Doubling the lateral resolution roughly quadruples the capture time, while doubling the scan rate halves the capture time.
Feedback panel parameters carry over from the force plot settings; however, changes may be required to protect the tip and optimize the force volume image. For silicon nitride tips, the Setpoint may be adjusted to within plus or minus several volts of the microscope noncontact, free-deflection signal value. For crystalline silicon TappingMode tips, the Setpoint should normally be increased no more than 1–3 volts below the RMS amplitude voltage; this helps protect the tip. In Force Volume imaging, triggers are used to set the direction reversal point of the Z-axis piezoelectric actuator during both height and force measurements. The Data Type parameter registers which data channel acts as the trigger. Usually, this is the same as the Data Type located on the Force Curves panel. The Trigger Mode determines the type of trigger to be employed, Relative, or Absolute. The trigger may also be turned Off. A Relative trigger measures the trigger threshold relative to the non-contact voltage deflection value and compensates for drift. An Absolute trigger measures the trigger threshold relative to the Setpoint. In most cases, a Relative trigger is preferable, as it offers better protection to the tip and sample by limiting the total force on the surface independent of Setpoint and drift. The Trig threshold parameter limits forces on the sample and the tip by “clipping” the Ramp size. For example, when using a relative trigger of 25 nm and a Ramp size of 500 nm, if the tip were to come into contact with the surface after extending only 300 nm of the scan size, the tip would halt its movement after 25 nm more extension (for a total of 325 nm) before retracting. Thus, tip-sample forces are constrained, and the force curve is defined for a controlled interval of tip-sample interaction. During the execution of a force curve with a trigger on, the piezoelectric actuator extends continuously, bringing the surface towards the tip until the tip is deflected to the Trig threshold value. Once deflecting to the Trig threshold value, the piezoelectric actuator retracts one Ramp size distance - it does not retract to the position defined by Z scan start. Thus, the collection of the next force curve begins at a piezo position one Ramp size value lower than the piezo position at the Trig threshold value. Keep this in mind when setting the Z scan start and Ramp size parameters if a relative trigger is used. NOTE: This discussion assumes that Sensitivity has been properly set and that the detector range has not been exceeded. Otherwise, the Trig threshold value does not correspond to the true deflection value.
In Force Volume imaging, triggers are used to set the turnaround point of the Z-axis piezoelectric actuator. The Trigger mode determines the type of trigger to be employed. Two types are offered: Relative and Absolute, or the trigger may be turned Off. NOTE: If the Trigger mode is turned Off, no height image is displayed.
The Data Type determines which data channel is to act as the trigger. (Normally, this is the same as Force Curves/Data Type.) A Relative trigger measures the trigger threshold with respect to the free-air deflection voltage value and compensates for drift. An Absolute trigger sets the threshold with respect to the Setpoint. Normally, a relative trigger is the preferable default, as it offers better protection to the tip and sample, limiting the total force on the surface independent of setpoint. NOTE: When using a Relative trigger threshold, be certain Ramp size (in the Z Scan panel) is sufficiently large to deflect the cantilever to the Trig[ger] threshold value and lift the tip clear of the surface. This ensures the tip is not ratcheted into the surface and dragged laterally through surface material during XY indexing.
To limit forces on the sample and tip, Ramp size may be clipped to within some Trig threshold value. For example, a tip which is being oscillated along the Z-axis with a Ramp size of 500 nm may have its Trig threshold set to -25.0 nm. When using a Relative type Trigger mode, if the tip encounters the sample surface after extending 300 nm, it halts its Z-axis extension at 325 nm, then reverses (retracts). Thus, tip-sample forces are limited and the force curve is defined for a controlled interval of tip-sample interaction. NOTE: This example assumes the Sensitivity parameter has been properly set (see step #2 above) and that the detector’s range has not been exceeded.
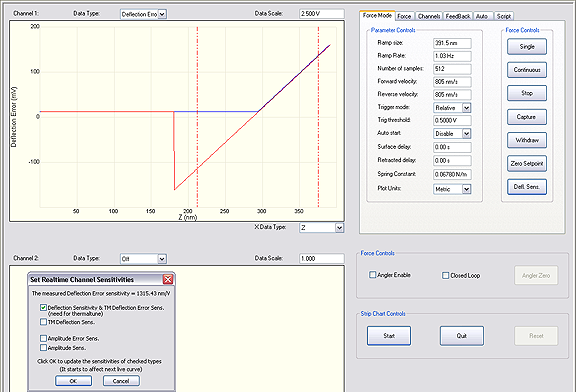
The Force Curves panel features parameters for the force plots region at the top right of the Force Volume display window. In most ways the force plots region is exactly like a Force Plot graph. The available settings for the Data Type parameter depend on the type of imaging being done. Set the Data Type accordingly. For Contact Mode force volume imaging, select Deflection Error, for instance. When beginning a Force Volume scan, set Z display to its maximum to locate the force plots. (The force curves resemble a thin line.) Data Scale is the range of deflection values plotted in the force curves region. Slowly decrease the Data Scale until the force plot fills most of the graph area. The Center plot parameter determines where the force plots are graphed relative to the current Setpoint. When Center plot is Off, the center horizontal line of the graph is positioned at the probe Setpoint value and deflection is measured from there. When Center plot is Enabled, the central horizontal line is positioned at the tip noncontact voltage (i.e., the voltage when the tip is just clear of the surface - in the noncontact portion of the curve) from which the deflection is measured.
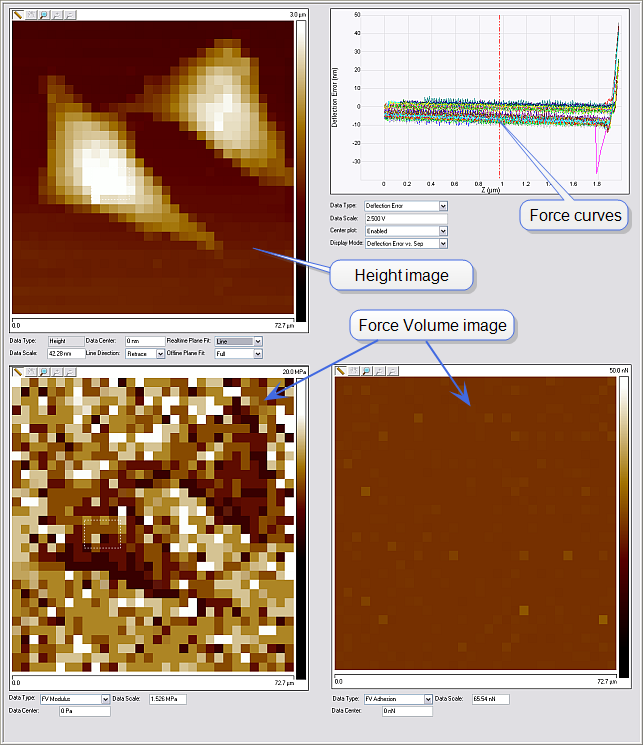
Parameters in the Force Volume panel control the type and range of forces viewed in the force volume image. In addition, the Data Scale parameter also affects the viewable range of data captured during force volume imaging. These parameters affect the real-time display of the force volume image only. The deflection at (X,Y), and Z-position data of each force curve (extending and retracting) are saved to disk. The Z direction parameter determines which portion of the Real-time force curve cycle, Extend or Retract, is shown in the force volume image. For example, if the force of interest is material elasticity, the Extend portion of the curve is selected. If adhesion forces are probed, then the Retract portion is usually used. The Data Scale parameter sets the range of values represented by the force volume image. Because the force volume image is generated line by line and the effects of changing Data Scale are not displayed until the next line of data is taken, several adjustments of this parameter may be needed before it is optimized. 
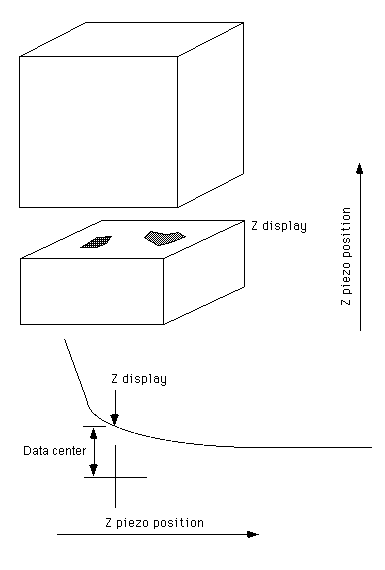
The Data Center parameter adds (or subtracts) a constant value to (or from) the data signal (Deflection Error in the case of Contact Mode force volume imaging). This is used to center the force volume data within the FV scale bar. For most applications, the value should coincide with a value on one of the force curves. This is most easily accomplished by positioning the cursor on a force curve. This centers the force volume image within the color bar of the specified Z display. Data Center can be set in two ways. The first is to simply enter the desired value in the control panel. The second is to use the cursors. Drag a vertical cursor from the left or right side of the plot region. Drag a horizontal cursor from the top or bottom of the plot region. Position the cursor vertically at the desired offset and click the left mouse button (see Figure 5). In a slice, the pixels are colored based on their distribution within the range defined by Data Scale and the Data Center. Modifying these parameters during data collection affects the display only. The raw deflection and piezoelectric actuator position data are saved. |
Figure 5: Data Center and Z display are Controlled by Cross-hairs
The Z display parameter determines which slice of the force volume is displayed in the force volume image region. Like Data Center, Z display can be set in two ways. The first is to enter the desired Z value of the slice in the control panel. The second is to use the mouse to change the horizontal position (that is, the Z position) of the cursor in the force plot region. For example, a Z display of 30 nm causes the force volume image region to depict forces on the tip when it is at a Z position of 30 nm above the piezoelectric actuator position at the Trig threshold. The Z display parameter may be thought of as defining bands of force at fixed distances from the sample surface. The Z display and Data Center parameters work in unison to define which portion of the superimposed force curves is plotted in the Force Curves panel of the force volume image. These parameters are also simultaneously represented as a green cursor on the force plot graph. Both Z display and Data Center may be changed by positioning the cursor with the mouse, or vice versa (i.e., the cursor is repositioned automatically whenever these parameters are changed.) The relationship of each parameter to the cursor is shown in Figure 6. |
Figure 6: Z display and Data Center in Relation to Cursor
|
|
![]() |
|
|
|
![]() |
|
NOTE: If parameters are changed during a scan, the capture is interrupted. To force the capture, click the Capture icon a second time. The more recent parameter value entries are saved with the image.
If you forgot to capture an image, and the next image is not yet complete, click Ctrl-B to Back Capture the image. You can also select Capture > Capture Last. Back capturing in Force Volume Mode captures whatever image was collected before the last change of frame direction, that is, in the slow-scan direction. |
|
Use of Capture Last can reduce the time required to gather data when only a non-square, rectangular subarea of the image is relevant (see Figure 7; panels 1–4 show a scan in progress). Begin scanning an image from the top, for example, of the image region. In panel one, a new frame (dark) is scanned from top to bottom. When the strip of interest has been scanned, click on the Frame Down icon (the scan is finished in panel 2). When the new image is beginning, enter CTRL-B to capture the strip. The slow-scan direction reverses in panel 3 and a new frame is begun (dark speckled). In panel four, the upward scan from panel 3 is interrupted and a new upward scan (light speckled) begins. The lower panels show what part of the scan is saved if the back capture is pressed in step 3 versus in step 4, after the new upward scan begins. |
Figure 7: Capture Last Assists Collecting Non-Square Force Volume Data (see text for discussion)
Another trick to imaging only strips of interest is to set Trig threshold to zero and the Ramp Rate to a high value (i.e.: 20 Hz) and begin a scan. When the tip is positioned near the beginning of the strip of interest, reset Trig threshold and Ramp Rate to their appropriate values and capture the image. |
www.bruker.com | Bruker Corporation |
www.brukerafmprobes.com | 112 Robin Hill Rd. |
nanoscaleworld.bruker-axs.com/nanoscaleworld/ | Santa Barbara, CA 93117 |
Customer Support: (800) 873-9750 | |
Copyright 2010, 2011. All Rights Reserved. |