A Force Volume Imaging "Jump Start"
This section provides an overview of force volume imaging for the casual reader or the experienced experimenter eager to get started. Force volume images require preliminary use of the Force Measurement function.
The basic procedure for generating a force volume image follows.

|
- Click the Select Experiment icon. This opens the Select Experiment window.
|
| |
- Select Mechanical Properties in the Experiment Category panel.
- Select Force Volume in the Select Experiment Group panel.
- Select the appropriate Force Volume experiment in the Select Experiment Panel.
- Click Load Experiment.
|

|
- Engage.
|
| |
- Create a height image of the surface of interest. This assigns values to image parameters, including image size.
|

|
- Switch to Ramp mode and generate a standard force curve featuring both contact and non-contact tip/sample interactions.
|
| |
- Set Sensitivity as described in your SPM Instruction Manual and set the Deflection Limit to 24.58V.
- Set Ramp Rate, Ramp size, and a Relative Trigger mode with a Trig threshold of approximately 40 nm. Ensure that triggering is functioning properly before proceeding.
|

|
- Switch back to Scan mode by clicking on the Scan icon in the Workflow Toolbar.
|

|
- Switch to Force Volume mode by clicking the Force Volume icon in the Workflow Toolbar.
|
| |
- This opens the Force Volume window, shown in Figure 1, and the Scan and Force Volume Parameter Lists, shown in Figure 2.
|
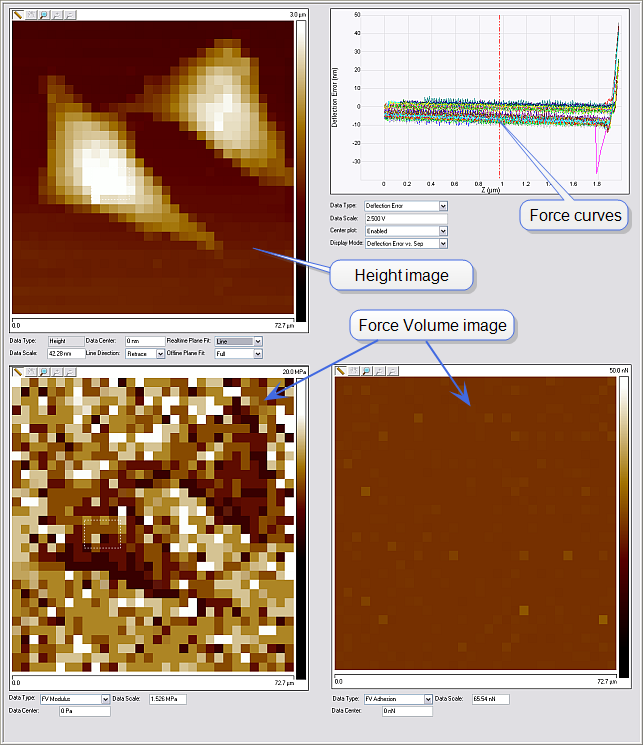
Figure 1: The Force Volume Interface
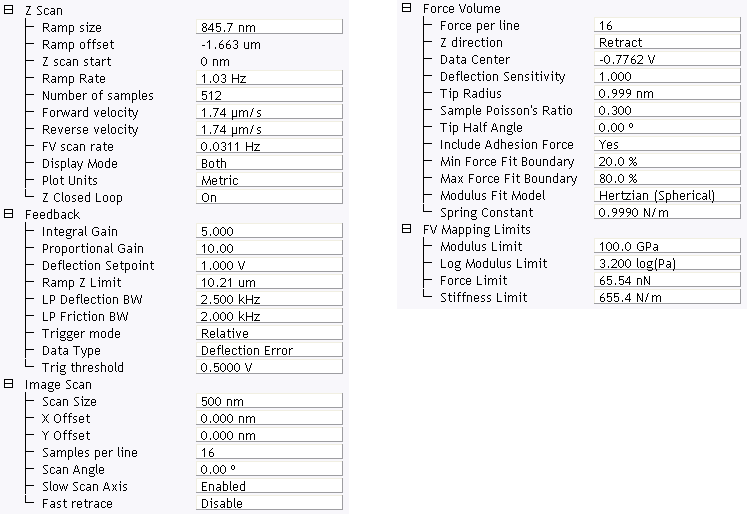
Figure 2: The Force Volume Parameter Windows
| |
- Verify the force plot parameters are still in effect in all control panels.
- Set the number of Samples per line to 16, the number of samples per force plot (Number of samples = 512), and the number of force plots (Force per line = 16).
- Start collecting data. Don't forget to capture the image.
|
Force volume mode displays the data in four separate, but interdependent, regions, shown in Figure 1. The top left image displays Height. The two bottom images display the force volume data or maps of nanomechanical properties. The force volume data are a horizontal (parallel to the sample surface) slice through the volume at a distance Z display above the piezo position at the deflection trigger. The girded region in the lower right corner of the screen displays force curves as they are collected. The position of the cross hairs determines the slice presented in the force volume region. The position of the horizontal cursor on the deflection axis of the force curves determines the offset of the scale bar in the force volume image. The position of the vertical cursor sets Z display.
While collecting data in this mode, it is possible to change the slice displayed and its offset without affecting the raw data. This is helpful in determining whether or not the parameters have been set correctly. Only data collected after the cursors are moved is displayed with the new Data Center and Z display.
You can turn Z Closed Loop On and Off without withdrawing the probe from the sample.
Force volume data can be evaluated offline like other images with the Bruker's NanoScope Analysis software, and, additionally, with specialized analysis options. Different slices can be chosen by sliding the vertical red line along the Z axis of the force plot region, clicking on and dragging the line with the mouse. Force curves can be displayed by clicking on appropriate pixels in either the image or volume region. Refer to the NanoScope Analysis manual for details.
| www.bruker.com
|
Bruker Corporation |
| www.brukerafmprobes.com
|
112 Robin Hill Rd. |
| nanoscaleworld.bruker-axs.com/nanoscaleworld/
|
Santa Barbara, CA 93117 |
| |
|
| |
Customer Support: (800) 873-9750 |
| |
Copyright 2010, 2011. All Rights Reserved. |
Open topic with navigation