This section describes how LFM images correlate with changes in frictional coefficients and height on a sample surface. Understanding these concepts is necessary when comparing and interpreting the information in LFM and Contact Mode images.
Figure 2, below, illustrates how a cantilever responds to changes in topography, and how that response correlates with the resulting LFM and height data. Vertical motion of the cantilever is depicted as a change in the vertical position of the cantilever. Lateral motion of the cantilever is depicted as a change in the angle of the tip with respect to the horizontal.

Figure 2: Cantilever Response to Change In Height with Corresponding Topography and LFM Signal Traces.
- Notice how a change in sample height creates both vertical and lateral changes in cantilever position (a). The lateral component is not reflected in the topography trace and resultant height image, which is based on the feedback loop driven by the vertical bending of the cantilever (b).
- In (c) you see the LFM signal trace that would result from the height changes in (a). As the figure shows, the LFM data reflects only the lateral components of bending (e.g., bending to the right at the rise in height produces a positive signal and bending to the left at the drop in height produces a negative signal).
In addition to changes in height, the cantilever will respond torsionally to changes in frictional coefficients, as illustrated in Figure 3, below:
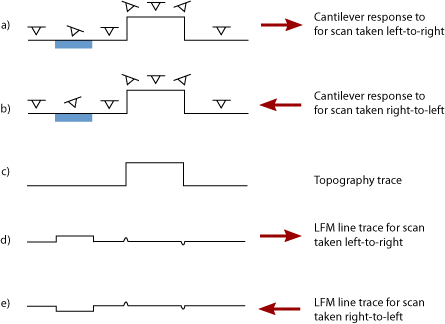
Figure 3: Cantilever Response to Change in Frictional Coefficient and Height, and Corresponding Contact Mode (AFM) and LFM Signal Traces.
- Notice the change in frictional coefficient that causes the cantilever to bend to the right when the scan line is taken from left to right (a). If the same scan is taken from right to left (b), the cantilever bends to the left as it passes over the area with the difference in frictional coefficient.
- As shown previously, a change in height causes cantilever bending due to vertical deflection. This information is reflected in the topography trace (c). Note that the data only reflect the change in sample height—the frictional differences are not reflected in the topography.
- Notice how the LFM signal trace that results from a scan taken from left to right (d) differs from the LFM signal trace that results when the scan is taken from right to left (e). The sign of the LFM signal flips for the change in friction, but not for the change in height.
Side-by-side height and LFM data therefore provide complementary information. By monitoring the LFM signal, the contribution of lateral cantilever bending to a Contact Mode image can be inferred. Conversely, having the Contact Mode information available confirms contrast changes on an LFM image due to changes in height, rather than changes in frictional coefficient.
When scanning, indicate whether X (horizontal) or Y (vertical) will be the fast scan direction. As an image is being taken, the scanner rasters back and forth over each scan line in the fast scan direction, and then advances to the next line in the slow scan direction. To maximize LFM signals, choose the scan angle so that the fast scan direction is perpendicular to the cantilever axis (scan angle 90 or 270 degrees). Once a fast scan direction has been selected, forward or reverse sweep data can be selected for viewing. For example, if fast scanning is the X scan, data collected from the right-to-left sweep of the scanner, the left-to-right sweep of the scanner, or from both sweep directions may be selected for viewing.
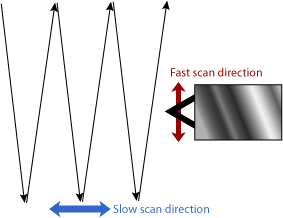
Figure 4: Fast Scan for Optimum LFM Data
 The LFM Signal
 Related Topics