Peak Force Tapping mode, the core technology behind PeakForce QNM and ScanAsyst modes, performs a very fast force curve at every pixel in the image. The peak interaction force of each of these force curves is then used as the imaging feedback signal. Peak Force Tapping mode modulates the Z-piezo at ~2 kHz (Icon, MultiMode. Catalyst operates at ~1 kHz.) with a default Peak Force Amplitude of 150 nm (0-peak). Analysis of force curve data is done on the fly, providing a map of multiple mechanical properties that has the same resolution as the height image.
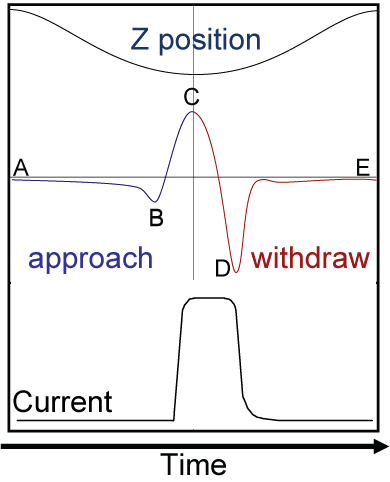
The Force vs. Time display, shown in Figure 1 is referred to as the “heartbeat.” When the tip is far from the surface (point A) there is little or no force on the tip. As the tip approaches the surface, the cantilever is pulled down toward the surface by attractive forces (usually van der Waals, electrostatic or capillary forces) as represented by the negative force (below the horizontal axis). At point B, the attractive forces overcome the cantilever stiffness and the tip is pulled to the surface. The tip then stays on the surface and the force increases until the Z position of the modulation reaches its bottom-most position at point C. This is where the peak force occurs. The peak force (force at point C) during the interaction period is kept constant by the system feedback. The probe then starts to withdraw and the force decreases until it reaches a minimum at point D. Adhesion is measured by the force at this point. The point where the tip comes off the surface is called the pull-off point; this often coincides with the minimum force. Once the tip has come off the surface, only long range forces affect the tip, so once again, the force is very small or zero when the tip-sample separation is at its maximum (point E).
Figure 1: The “heartbeat.” Z position, Force and Current as a function of time during one Peak Force Tapping cycle. Blue indicates approach while red indicates retract.
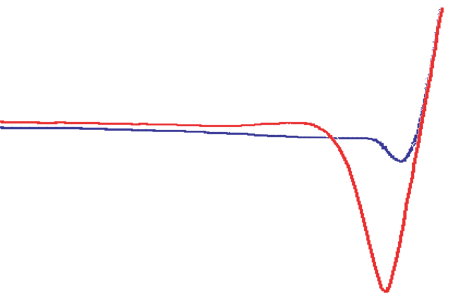
Using the Z-position information, the heartbeat is transformed into a force curve, shown in Figure 2. The force curve plot is analyzed, on the fly, to produce the peak interaction force as the control feedback signal and the mechanical properties of the sample (Adhesion, Modulus, Deformation, Dissipation).
| www.bruker.com | Bruker Corporation |
| www.brukerafmprobes.com | 112 Robin Hill Rd. |
| nanoscaleworld.bruker-axs.com/nanoscaleworld/ | Santa Barbara, CA 93117 |
| Customer Support: (800) 873-9750 | |
| Copyright 2010, 2011. All Rights Reserved. |