PFM Vertical Domain Scanning
Once the microscope engages on the surface, optimize the parameters to obtain a good scan of the surface and PFM data. On the PPLN sample, a scan size of 40 μm may be required to map one period or two complete domains oriented opposite to each other in the c-direction.
- Upon engage, ensure the Z-piezo is centered in its Z-scan range.
- Optimize scan parameters while watching the displayed image with Channel 1/Data Type set to Height Sensor
- Set the LS PR Drive Amplitude to 2000 mV.
- If it was disabled prior to engaged, re-select Sample in the AC Bias drop-down menu.
- At this point, you may reduce the Deflection Setpoint to 0.1 V to reduce tip-wear:

- You may also reduce the Z-limit to 2 μm:

You will see a resolution improvement in the height image and in the DeflectionIn1B channel.
NOTE: Reducing the Deflection Limit only provides additional bit resolution but does not multiply the deflection by a factor as the vertical
16X Gain does.
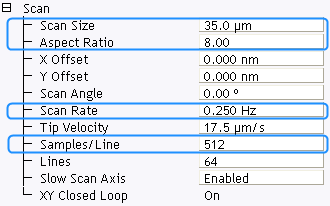
- For typical operations on the PPLN sample, make the following scan parameter adjustments. Increase the number of Samples/Line to 512. Increase the Aspect Ratio to 8 to speed up the imaging process. Decrease the Scan Rate to 0.25 Hz and increase the Scan Size to 35 μm.
- Adjust the PR Drive Amplitude to optimize contrast in your PR image.
- Set the PR Drive Frequency.
NOTE: The PR Drive Frequency is set to excite piezoresponse in the chosen sample. Typical values are between 12 and 20 kHz, though 60 kHz PR imaging has also been successful. The bias frequency should be well above the scan rate so at least one full bias cycle is performed at each pixel in a piezoresponse image.
- Set PR Drive Phase to 0° initially.
- Select PR Amplitude in Channel 4 and PR Phase for Data Type in Channel 5.
NOTE: These are the Piezoresponse workspace default channels.
- The Channels view should already be showing contrast in the LS PR Phase Channel. If the contrast is not visible in the LS PR Phase Channel, change the scan angle to 90 degrees in the Scan panel.
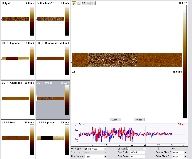
Figure 1: LS PR Phase data, not yet optimized (Hover over the image to view larger)
This may be adjusted to optimize the piezoresponse phase image. See Understanding the NanoScope V Lock-in.To draw meaningful conclusions from the measurements, it is important that the optimizations be performed.
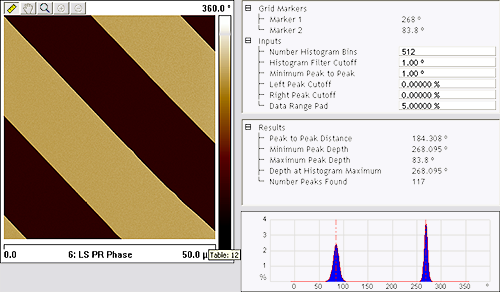
The image below shows the PPLN crystal under optimized conditions. It was obtained using the low speed lock-in operating with a bandwidth of 0.3 kHz, LS PR Drive Amplitude of 10 V at 17 kHz with a LS PR Drive Phase of 84 degrees. The linear velocity of the tip was 20 μm/sec.

The depth profile of the PR Phase measurement of the image above is shown here:
| www.bruker.com
|
Bruker Corporation |
| www.brukerafmprobes.com
|
112 Robin Hill Rd. |
| nanoscaleworld.bruker-axs.com/nanoscaleworld/
|
Santa Barbara, CA 93117 |
| |
|
| |
Customer Support: (800) 873-9750 |
| |
Copyright 2010, 2011. All Rights Reserved. |
Open topic with navigation