Scanning probe microscopes are a family of instruments used for studying surface properties of materials from the micrometer all the way down to the atomic level. Two fundamental components that make scanning probe microscopy possible are the probe and the scanner. The probe is the point of interface between the SPM and the sample; it is the probe that intimately interrogates various qualities of the surface. The scanner controls the precise position of the probe in relation to the surface, both vertically and laterally.
When two materials are brought very close together, various interactions are present at the atomic level. These interactions are the basis for scanning probe microscopy. An SPM probe is particularly sensitive to such interactions and is designed to sense them. Specifically, when an SPM probe is brought very close to a sample surface, the interaction can be correlated to the distance between the probe and sample. Since the magnitude of this interaction varies as a function of the probe-sample distance, the SPM can map a sample’s surface topography by scanning the probe in a precise, controlled manner over the sample surface. See the Probe Selection and Handling for more information about scanning probes.
The material that provides the precise positioning control required by all SPM scanners is piezoelectric ceramic. Piezoelectric ceramic changes its geometry when a voltage is applied; the voltage applied is proportional to the resulting mechanical movement. The piezoelectric scanner in an SPM is designed to bend, expand, and contract in a controlled, predictable manner. The scanner, therefore, provides a way of controlling the probe-sample distance and of moving the probe over the surface. See Piezoelectric Scanners for more information.
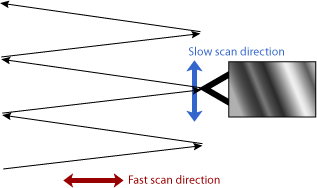
The scanner moves the probe over the surface in a precise, defined pattern known as a raster pattern, a series of rows in a zigzag pattern covering a square or rectangular area. Data can be collected as the probe moves from left to right (the “trace”) and from right to left (the “retrace”). The ability to collect data in both directions can be very useful in factoring out certain effects that do not accurately represent the sample surface. The trace-and-retrace movement is sometimes referred to as the “fast scan direction.” The direction perpendicular to the fast scan direction is sometimes referred to as the “slow scan direction.”
The number of data points in each scan line and the number of scan lines that cover the image area will determine the image resolution in the fast and slow scan directions, respectively. See Raster Scan Parameters for more information
As the scanner moves the probe along each line in the raster pattern, the error signal can be interpreted as a series of data points. The SPM image is then generated by plotting the data point-by-point and line-by-line. Other signals can also be used to generate an image. SPM imaging software displays the image in a useful way. For example, the height and color scales can be adjusted to highlight features of interest.
The ultimate quality of the SPM image is determined by a number of factors, not the least of which is the probe quality and characteristics. See AFM Image Quality and the Probe and Sample Guide for more information.
SPMs employ a method known as Z feedback to ensure that the probe accurately tracks the surface topography. The method involves continually comparing the detector signal to the setpoint. If they are not equal, a voltage is applied to the scanner in order to move the probe either closer to or farther from the sample surface to bring the error signal back to zero. This applied voltage is commonly used as the signal for generating an SPM image.
Scanning can be performed with Z feedback turned on or off. With feedback off, the error signal is used to generate the image. With feedback on, the image is based on the voltage applied to the scanner. Each mode has advantages and disadvantages. Scanning with Z feedback turned off is faster, as the system does not have to move the scanner up and down, but it only provides useful measurement information for relatively smooth surfaces. While scanning with feedback on takes more time, it allows the measurement of irregular surfaces with high precision.
The feedback signal used by the system depends on whether you are performing Atomic Force Microscopy (AFM) or Scanning Tunneling Microscopy (STM) experiments. See Z Feedback Loop for more information.
| www.bruker.com | Bruker Corporation |
| www.brukerafmprobes.com | 112 Robin Hill Rd. |
| nanoscaleworld.bruker-axs.com/nanoscaleworld/ | Santa Barbara, CA 93117 |
| Customer Support: (800) 873-9750 | |
| Copyright 2010, 2011. All Rights Reserved. |
 Related Topics