You are here: NanoScope Software User Guide > Offline Commands > Analysis Functions > Step

Step

The Step analysis makes relative height measurements between two regions (steps) on sample surfaces. Typical applications include measuring film thickness and etch depths. Step works similarly to a Section analysis with an averaging box cursor, but its operation is simplified.

Step displays a top view of the image, then the user draws a reference line across the regions to be measured. A height profile is generated from averaged data on either side of the reference line in the box. Cursors—which are moved along the profile—define specific regions (steps). These may be measured (Measure button) relative to each other, with or without data leveling (Level button).

Step Procedure

 
  1. Select an image file from the file Browse window at the right of the main window. Double click the thumbnail image to select and open the image.
  1. You can open the Step view, shown in using one of the following methods: 
    • Right-click on the image name in the Workspace and select Add View > Step from the popup menu. See Figure 1.

Figure 1: Select Step from the workspace


Or

  • Right-click on a thumbnail in the Multiple Channel window and select Step.

Or

  • Select Analysis > Step from the menu bar.

Or

  1. Click the Step icon in the NanoScope toolbar.
 
  1. The Step view, shown in Figure 2, appears showing results for the entire image.

Figure 2: The Step view

 
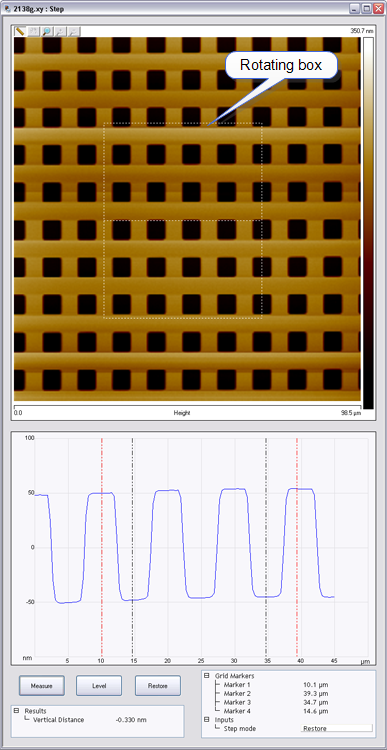
  1. To run the Step Analysis for a region of the image, use the mouse to draw a rotating box in the desired location. The Step interface includes a captured image and a graph of averaged height within a selected box.
  2. By holding down the shift key while dragging the edge of the box, it can be rotated. Rotation is sometimes required when features of interest are not horizontal.
  3. In the height graph area below the image, two pairs of cursors (one black and one red) can be moved across this profile to define the steps to be measured. To insert cursors, move the mouse in the height graph to the left of the Y axis. The cursor will change to a double-headed arrow. Using the left mouse button, drag the double-headed arrow to the desired step location. This can be repeated for a second cursor. The region between each pair of cursors defines a “step.” The marker position is shown below the height graph.
  4. Once the two pairs of cursors are added to the height graph, the system will report the vertical distance between the average heights of the two steps in the Results area.
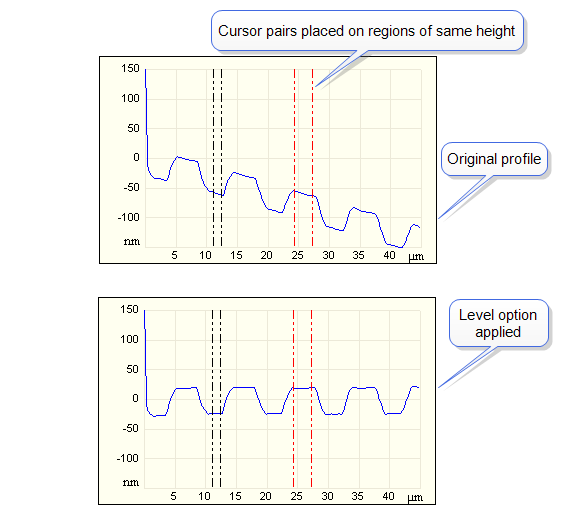
  5. If the profile is tilted, click Level and, using the cursors, select two steps that should have the same height. The slope of the profile changes to level the two steps.

Figure 3: Level Option Profile

 
  1. To measure the vertical distance between the leveled steps, click the Measure button again and readjust the cursors to compare the selected steps.

Step Display Menu Commands & Results

Parameter Description

Measure

Displays the relative height between steps

Level

Re-orients the profile so that the average height of each step region (between cursor pairs) is equal

Restore

Returns the profile to its original, unleveled form (De-selects the Level option)

Results:

  • Vertical Distance
Displays the distance between the average height of each region (between cursor pairs). If the height of the region between the second pair of cursors is lower than the firsts's, this will be a negative value.


www.bruker.com Bruker Corporation
www.brukerafmprobes.com 112 Robin Hill Rd.
nanoscaleworld.bruker-axs.com/nanoscaleworld/ Santa Barbara, CA 93117
   
  Customer Support: (800) 873-9750
  Copyright 2010, 2011. All Rights Reserved.