|
|
Due to temperature differences, thermal lateral drift can occur between two successive images while scanning. Using XY Drift analysis can calculate the lateral shift between two images. You can also manually enter the drift. |
Two images captured sequentially with the same scan direction are required. The capture and trace directions must be the same for both images (up/down, trace/retrace), and the images must have the same microscope configuration and scanner calibration properties.
To calculate XY Drift using NanoScope software:
|
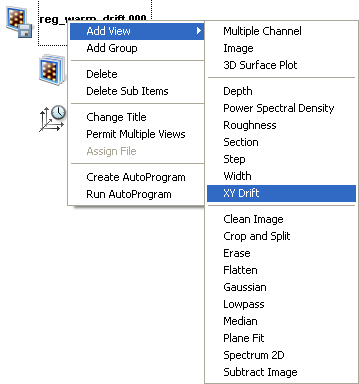
Figure 1: Select XY Drift from the workspace
|
Or
Or Select Analysis > XY Drift from the menu bar. Or |
|
|
|
|
|
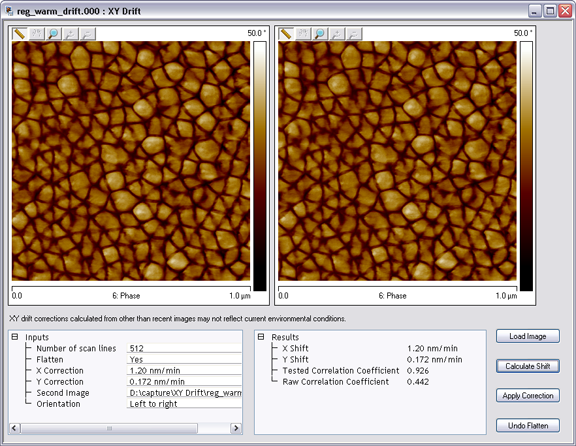
NOTE: Apply Correction affects RealTime by applying a drift correction to the RealTime images. Do not use Apply Correction if this is not your intent.
NOTE: XY drift corrections calculated from other than the two most recently captured images may not reflect current environmental conditions.
|
Statistics used by the XY Drift analysis are defined in this section.
| Parameter | Description |
|---|---|
|
Number of scan lines |
Specifies the number of lines to calculate. |
|
Flatten |
Flattens both images before the shift is calculated. (Use the Undo Flattenbutton to reverse the flatten). |
| Specifies the amount of correction to apply to the X-axis of the scanner. | |
| Specifies the amount of correction to apply to the Y-axis of the scanner. | |
|
Second Image |
Defines the location of the second image used in the analysis. |
| Speeds up the shift calculation by averaging for images larger than 512 pixels | |
|
Orientation |
Settings: Order of operation
|
Results of the XY Drift analysis are presented in this section.
| Parameter | Description |
|---|---|
| Specifies the amount of calculated shift along the X-axis of the second image relative to the first. | |
| Specifies the amount of calculated shift along the Y-axis of the second image relative to the first. | |
| Reports the correlation coefficient after correcting for the detected shift. A perfect correlation is 1.0. If the tested correlation coefficient is too low, then the calculation is not valid and should not be applied. You may need features that have more distinct contrast. | |
| Reports the correlation coefficient between the two images prior to processing. |
Table 2: Results Parameters
| Parameter | Description |
|---|---|
| Browse to open the second image in the right box. | |
| Compares left image to right image, and reports the shift statistics in the Results box. | |
| Applies the correction in the Inputs box to the second image. | |
| Undo Flatten restores the image to its original form. |
Table 3: XY Drift Buttons
| www.bruker.com | Bruker Corporation |
| www.brukerafmprobes.com | 112 Robin Hill Rd. |
| nanoscaleworld.bruker-axs.com/nanoscaleworld/ | Santa Barbara, CA 93117 |
| Customer Support: (800) 873-9750 | |
| Copyright 2010, 2011. All Rights Reserved. |