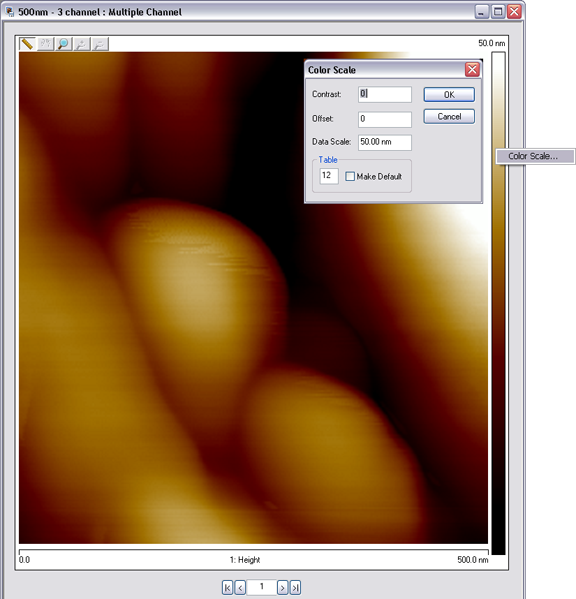
Right clicking in the color bar along the right side of the image will produce the Color Scale button. Clicking on this Color Scale button will open the Color Scale dialog box, shown in Figure 1.
Figure 1: The Color Scale Dialog
The Color Scale dialog allows the following image adjustments:
There are 26 available color scales. For instance, Color Table 0 is grayscale while Color Table 1 features blue.
You may change the Color Table by entering a color table number into the Table dialog box. You may also make that the default color table for new files.
Table 1 displays a list of the 26 NanoScope color tables with Contrast = 0 and Offset = 0.
| Color Table ID | Colors |
|---|---|
| 0 |

|
| 1 |

|
| 2 |

|
| 3 |

|
| 4 |

|
| 5 |

|
| 6 |

|
| 7 |

|
| 8 |

|
| 9 |

|
| 10 |

|
| 11 |

|
| 12 |

|
| 13 |

|
| 14 |

|
| 15 |

|
| 16 |

|
| 17 |

|
| 18 |

|
| 19 |

|
| 20 |

|
| 21 |

|
| 22 |

|
| 23 |

|
| 24 |

|
| 25 |

|
Table 1: NanoScope Color Tables
Set the Data Scale in the Color Scale window to set the data range.
Both Contrast and Offset, adjustable in the Color Scale window, have a major effect on displayed colors. An example is shown for Color Table 12 in Figure 2.
Offset - Number (–128 to +128) designates offset colors in the displayed image (e.g., 120 shows illuminated background on image). Offset effectively changes the color value around which the color scale is mapped.
Contrast - Number (–10 to +10) designates contrast of colors in displayed image (e.g., –10 shows little change while 10 shows highest contrast)
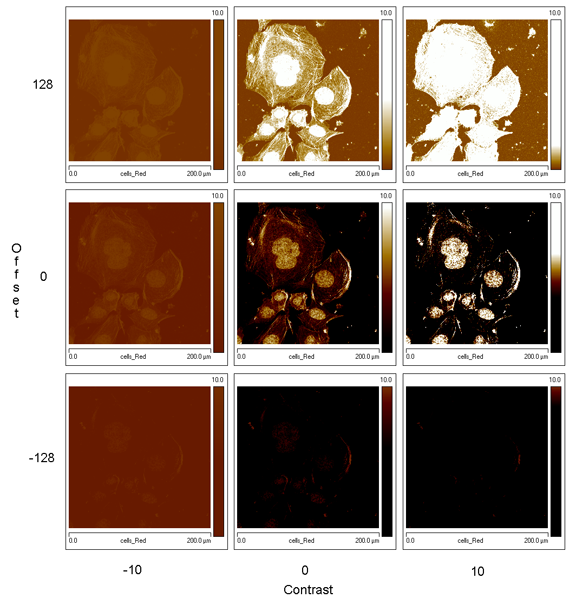
Figure 2: Effect of Contrast and Offset on displayed color for Color Table 12
| www.bruker.com | Bruker Corporation |
| www.brukerafmprobes.com | 112 Robin Hill Rd. |
| nanoscaleworld.bruker-axs.com/nanoscaleworld/ | Santa Barbara, CA 93117 |
| Customer Support: (800) 873-9750 | |
| Copyright 2010, 2011. All Rights Reserved. |