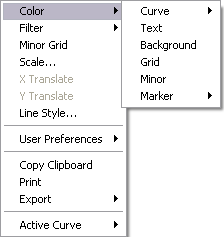
Measurement cursors for the histogram are automatically positioned based on the numerical values selected in the Input fields. Right-clicking on the grid will bring up the Grid Parameters menu, shown in Figure 1, and allow for the changes listed in Table 1.
Figure 1: Grid Parameters Menu
| Parameter | Description |
|---|---|
| Color | Allows the operator to change the color of the: Curve, Text, Background, Grid, Minor Grid, and Markers |
| Filter | Typically used for a Profiler scan. Type - Select None, Mean (default), Maximum, or Minimum. Points - Select 4k, 8k (default), 16k, or 32k. |
| Minor Grid | Places a minor grid in the background of the Vision window. |
| Scale | Allows the user to auto scale, set a curve mean, or set their own data range. |
| Line Style | For each curve, the operator can choose a connect, fill down, or point line. |
| User Preference | Restore - Reverts to initial software settings. Save - Saves all changes operator has made during this session. This becomes the new default settings. |
| Copy Clipboard | Copies the grid image to the Microsoft clipboard. |
| Prints out the current screen view to a printer. | |
| Export | Exports data in bitmap, JEPG, or XZ data format. |
| Active Curve | Determines which curve you are analyzing. |
Table 1: Common Grid Control Parameters
| www.bruker.com | Bruker Corporation |
| www.brukerafmprobes.com | 112 Robin Hill Rd. |
| nanoscaleworld.bruker-axs.com/nanoscaleworld/ | Santa Barbara, CA 93117 |
| Customer Support: (800) 873-9750 | |
| Copyright 2010, 2011. All Rights Reserved. |