| Marker Pair 1: |
|
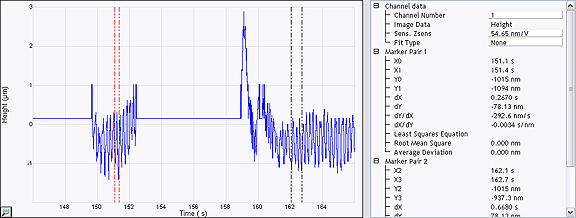
| X0 |
Z position of first marker, Marker Pair 1 |
| X1 |
Z position of second marker, Marker Pair 1 |
| Y0 |
Deflection/oscillation position of first marker, Marker Pair 1 |
| Y1 |
Deflection/oscillation position of second marker, Marker Pair 1 |
| X1 - X0 |
Z distance between markers in Marker Pair 1 |
| Y1 - Y0 |
Deflection/oscillation space between markers in Marker Pair 1 |
| dY/dX |
Slope of Marker Pair 1 |
| dX/dY |
1/Slope of Marker Pair 1 |
| Least Squares Equation |
|
| Root Mean Square |
|
| Average Deviation |
|
| |
|
| Marker Pair 2: |
|
| X2 |
Z position of first marker, Marker Pair 2 |
| X3 |
Z position of second marker, Marker Pair 2 |
| Y2 |
Deflection/oscillation position of first marker, Marker Pair 2 |
| Y3 |
Deflection/oscillation position of second marker, Marker Pair 2 |
| X3 - X2 |
Z distance between markers in Marker Pair 2 |
| Y3 - Y2 |
Deflection/oscillation space between markers in Marker Pair 2 |
| dY/dX |
Slope of Market Pair 2 |
| dX/dY |
1/Slope of Marker Pair 2 |
| Least Squares Equation |
|
| Root Mean Square |
|
| Average Deviation |
|