| |
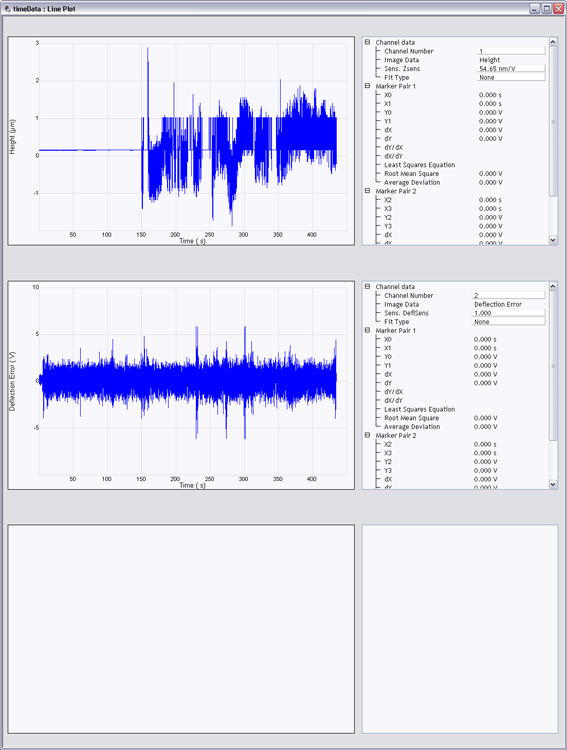
- To add markers, position the mouse in the graph area to the left of the Y axis. The standard cursor will change to a double-headed cursor. When the double-headed cursor appears, left-click the mouse, and drag the cursor to the desired position. The data for the position is automatically updated in the Marker Pair Results area.
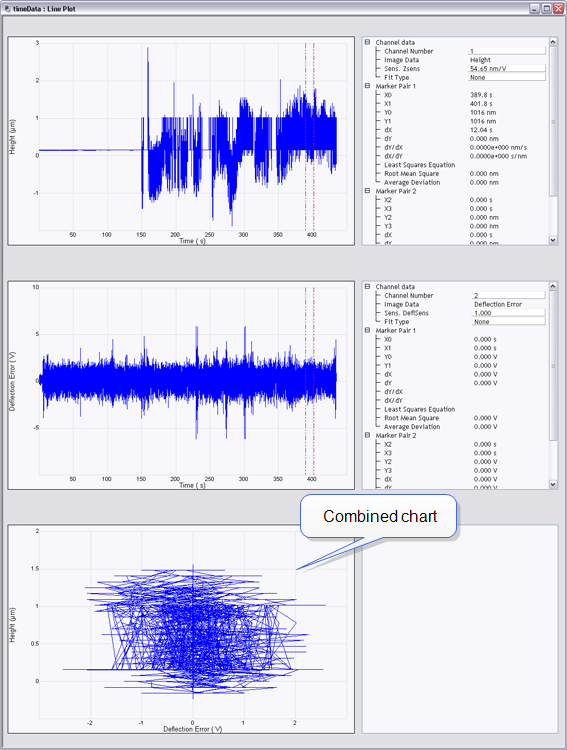
- When a marker pair has been added, the combined channel plot, shown as the bottom plot in Figure 2, will appear. The combined plot includes only the data between the markers.
|