The Plane Fit command computes a single polynomial of a selectable order for an image and subtracts it from the image. The Plane Fit operation can be applied to either the X, Y, or both XY directions.
|
|
The Plane Fit command computes a single polynomial of a selectable order for an image and subtracts it from the image. The Plane Fit operation can be applied to either the X, Y, or both XY directions. |
Box cursors or passbands allow specific points to be used in the calculation of the polynomial. Click on the image to start drawing a passband box. Right-click on a box to delete it or change its color.
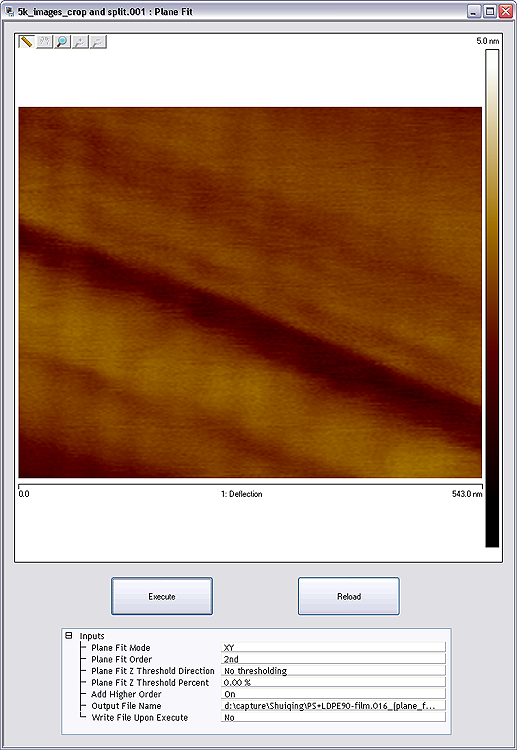
Figure 1 illustrates an image with tilt and bow which could affect the analysis of the surface data.
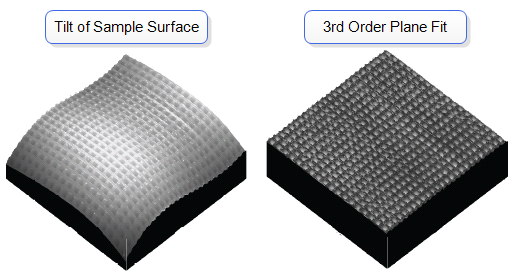
Figure 1: Visual Representation of Plane Fit
Refer to Table 1 to view the polynomials that calculate the best plane fit for the images in the Plane Fit Auto function.
| Order | Variable | Polynomial Equation |
|---|---|---|
|
0 |
X |
z = a |
|
Y |
z = a | |
|
XY (Add Higher Order Cross Terms for XY OFF) |
z = a | |
|
XY (Add Higher Order Cross Terms for XY ON) |
z = a | |
|
1 |
X | z = a + bx |
| Y | z = a + by | |
| XY (Add Higher Order Cross Terms for XY OFF) | z = a + bx + cy | |
| XY (Add Higher Order Cross Terms for XY ON) | z = a + bx + cy + dxy | |
|
2 |
X |
z = a + bx + cx2 |
|
Y |
z = a + by + cy2 | |
|
XY (Add Higher Order Cross Terms for XY OFF) |
z = a + bx + cy + dxy + ex2 + fy2 | |
|
XY (Add Higher Order Cross Terms for XY ON) |
z = a + bx + cy + dxy + ex2 + fy2+ gxy2 + hx2y + ix2y2 | |
|
3 |
X |
z = a + bx + cx2 + dx3 |
|
Y |
z = a + by + cy2 + dy3 | |
|
XY (Add Higher Order Cross Terms for XY OFF) |
z = a+ bx + cy + dxy + ex2 + fy2 + gxy2 + hx2y + jx3 + ky3 | |
|
XY (Add Higher Order Cross Terms for XY ON) |
z = a + bx + cy + dxy + ex2 + fy2+ gxy2 + hx2y + ix2y2 + jx3 + ky3 + lxy3 + mx2y3 +nx3y3 +ox3y + px3y2 |
Table 1: Plane Fit Auto Equations
|
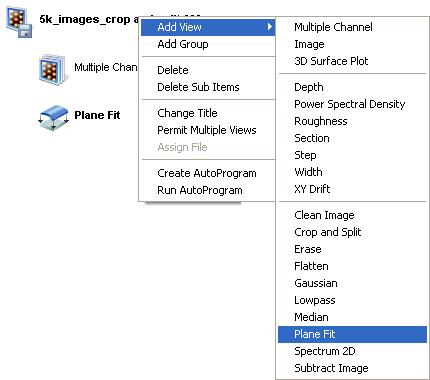
Figure 2: Select Median from the Workspace
|
Or
Or
Or |
|
|
|
|
|
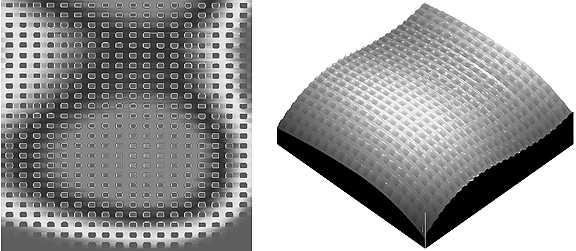
Figure 3: Saddle Image Before Plane Fit
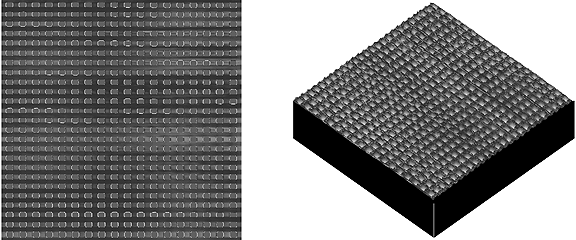
Figure 4: Plane Fit Image
Now, experiment with this image to explore the range of Plane Fit capabilities. Try the following:
A series of parameters appear in the Plane Fit view, allowing the order of the Plane Fit polynomial to be selected and display parameters to be adjusted.
| Parameter | Description |
|---|---|
|
Plane Fit Mode |
X, Y, XY |
|
Plane Fit Order selects the order of the polynomial calculated and subtracted from each scan line. Settings:
|
|
|
Specifies the range of data to be used for the polynomial calculation based on the distribution of the data in Z: Range or Settings:
|
|
|
Plane Fit Z Threshold Percent |
Defines a Z value as a percentage of the entire Z range in the image (or data set) relative to the lowest data point. |
|
Add Higher Order |
Turning this on adds higher order cross terms to the polynomial fit when XY is chosen (see Table 1). |
|
Output File Name |
Specifies the name of the file to be created. Leave blank for immediate view/use without saving the altered image file. |
|
Write File Upon Execute |
Writes the output file when the Execute button is clicked. |
Table 2: Plane Fit Range, Settings and Buttons
| Parameter | Description |
|---|---|
|
Execute |
Initiates the Flatten command, based on the order selected.. |
|
Reload |
Restores the image to its original form by reloading the original file. |
Table 3: Buttons on the Plane Fit Panel
| www.bruker.com | Bruker Corporation |
| www.brukerafmprobes.com | 112 Robin Hill Rd. |
| nanoscaleworld.bruker-axs.com/nanoscaleworld/ | Santa Barbara, CA 93117 |
| Customer Support: (800) 873-9750 | |
| Copyright 2010, 2011. All Rights Reserved. |