| Control | Description |
|---|---|
|
Trigger mode |
Limits the amount of force exerted by the tip upon the sample. It is possible to operate the trigger independent of drift (Relative) or at some arbitrarily fixed point (Absolute) depending on the trigger settings. |
|
Data Type |
Channels may be assigned for triggering to any input signal available including: Deflection, Amplitude, Phase or Friction data. |
|
Trig threshold |
The value of the cantilever deflection, as measured by the photodetector, desired for the indentation or scratch. The Trigger threshold defines the maximum force applied to the sample corresponding to the upper right-most point on the force plot. Range or Settings:
|
|
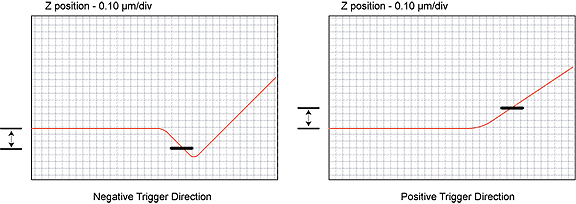
Trig direction |
Determines the direction of the trigger and allows for a Positive, Negative, or Absolute trigger slope. In this way, the trigger may be configured to activate on either the positive or negative direction of the force curve. See Figure 1. |
|
Start Mode |
Start mode allows you to switch between the various force modes without returning to image mode. Range or Settings:
|
|
End Mode |
Determines the location of the tip when the microscope is returned to Image mode. Range or Settings:
|
| Z Step Size | The change in tip height per step when using force step. |
| Auto Start |
Range or Settings:
|
|
Surface delay |
Specifies a delay when the tip reaches the point closest to the sample. Range or Settings:
|
|
Retracted delay |
Similar to Surface delay, this value specifies the duration of the delay when the piezo is at the top of the cycle (farthest away from the sample). Range or Settings:
|
|
Strip Chart Rate |
Frequency of (Z-position, deflection) data point acquisition for strip chart. Range:
|
| Strip Chart Size |
Time interval over which (Z-position, deflection) data points are displayed in the strip chart. Range:
NOTE: Although the strip chart collects and displays data over the time interval defined by clicking Start, then later, Stop, this data is not saved for subsequent use until the Capture icon is clicked. If Capture is clicked while strip chart data is being taken, what is saved begins at the start of the chart (sooner than the icon is clicked).
|
| www.bruker.com | Bruker Corporation |
| www.brukerafmprobes.com | 112 Robin Hill Rd. |
| nanoscaleworld.bruker-axs.com/nanoscaleworld/ | Santa Barbara, CA 93117 |
| Customer Support: (800) 873-9750 | |
| Copyright 2010, 2011. All Rights Reserved. |