Open Loop SCM Imaging
| |
- Set the SCM controls panel parameters in the Feedback and SCM panels to the initial settings shown in Table 1.
|
| SCM Feedback |
Disabled |
Enabled/Disabled |
| AC Bias Amplitude |
2000 mV |
0–10 V |
| Bias Frequency |
90 kHz |
0.5–5000 kHz |
| SCM Lock-In Phase |
90º |
±180º |
| DC Bias |
0.0 V |
±10 V |
| Capacitance Sensor Frequency |
See 1st Note |
880-1050 MHz |
| SCM Igain |
10 |
0–50 |
| SCM Pgain |
10 |
0-50 |
| Feedback Setpoint |
2 V |
0.05–10 V |
| Feedback Limit |
6 V |
0–20 V |
Table 1: Initial SCM Settings
NOTE: The SCM Application Module Capacitance Sensor Frequency is set to correspond to the radiated emissions of electromagnetic energy limit of the region to which the application module is shipped. These limits are:
| United States |
915±13 MHz |
| International |
>1000 MHz |
NOTE: SCM is a Contact Mode technique. For the initial settings of the Scan parameters and the Feedback parameters in Contact Mode, refer to your microscope instruction manual.
| |
- Assign the following Data Types to Channels:
- Channel 1: Height
- Channel 2: Deflection Error
- Channel 3: dC/dV I
- Channel 4: dC/dV Q
- Channel 5: dC/dV Amplitude
- Channel 6: dC/dV Phase
- Channel 7: SCM Data
- Channel 8: DC Capacitance
- For SCM data, set both Real-time Plane Fit and Offline Plane Fit to None. For topography data, set these two parameters to the desired setting.
|

|
- Click Engage (shown) to start scanning.
|
NOTE: It will probably be necessary to make adjustments to a number of parameters (Integral Gain, Proportional Gain, Deflection Setpoint, etc.) before the image is optimized.
| |
- To minimize tip/sample wear, decrease the tip/sample contact force as much as possible, either by:
- obtaining a force plot and adjusting the Deflection Setpoint to a level just above the pull-off value, thus minimizing the force (see your instruction manual).
- observing the Height trace while reducing the Deflection Setpoint. This reduces the force applied to the sample until the tip eventually lifts off the sample surface. You may go back to contact by slightly increasing the setpoint until you obtain a focused image.
- While scanning, it will probably be necessary to make adjustments to a number of parameters in the Feedback panel before the SCM image is optimized. Adjust parameters within the ranges shown in Table 1. As parameters are adjusted, differences in the image become more apparent, leading to a better understanding of SCM. Tune some of the parameters, in particular the Capacitance Sensor Frequency and the SCM Lock-In Phase, using the features presented in Sweeping Using the Generic Sweep Command.
|
In open loop SCM operation, you may acquire SCM images in DC Capacitance, dC/dV Amplitude Error, dC/dV I, dC/dV Q, dC/dV Phase or SCM Data modes by selecting different Data Type parameters in the Channel panels (see Figure 1, Table 2 and Figure 2). The lock-in amplifier operates at the same frequency as that used for the AC bias voltage.
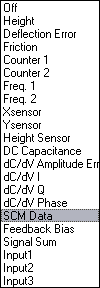
Figure 1: SCM Data Type Parameters
| Height |
Height derived from the voltage applied to the Z piezo as the cantilever scans the sample surface in feedback. |
| DC Capacitance |
|
| dC/dV Amplitude Error |
Amplitude data from the lock-in amplifier. |
| dC/dV I |
X component data from the lock-in amplifier. |
| dC/dV Q |
Y component data from the lock-in amplifier. |
| dC/dV Phase |
Phase of the auxilary lock-in amplifier. |
| SCM Data |
Amplitude data lock-in signed by the slope of the dC/dV curve. |
Table 2: Data Type Parameter Definitions
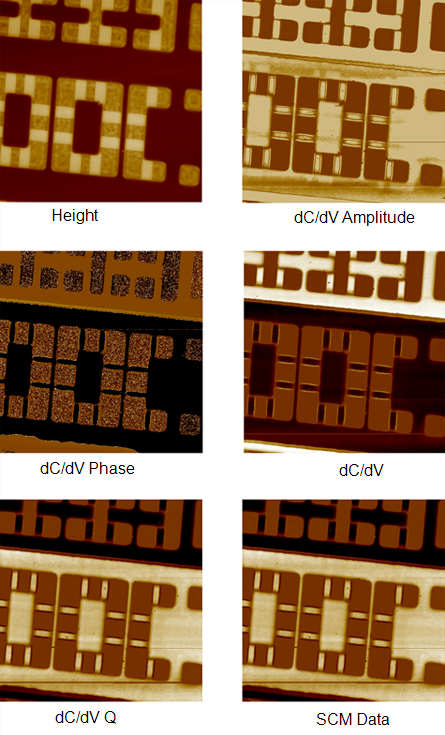
Figure 2: Open Loop SCM Images of the SRAM Test Sample
| www.bruker.com
|
Bruker Corporation |
| www.brukerafmprobes.com
|
112 Robin Hill Rd. |
| nanoscaleworld.bruker-axs.com/nanoscaleworld/
|
Santa Barbara, CA 93117 |
| |
|
| |
Customer Support: (800) 873-9750 |
| |
Copyright 2010, 2011. All Rights Reserved. |
Open topic with navigation