Closed Loop XY Calibration
A separate set of parameters is used to control the scanner XY position when XY is
on. These are called the OptoXY Closed Loop Calibration parameters. In addition to the
parameter, XY Closed Loop, in the Scan panel, a new panel, OptoXY Closed Loop Calibration, contains scanner calibration parameters associated with the Dimension Icon scanner.
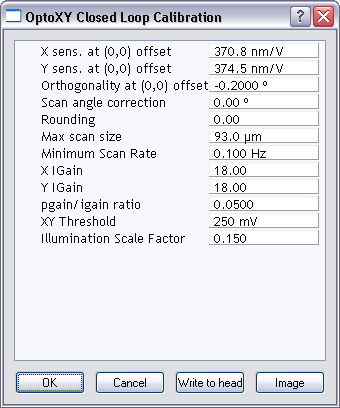
With Scan > XY Closed Loop set to On, click Calibrate > Scanner > X-Y to open the
OptoXY Closed Loop Calibration panel:
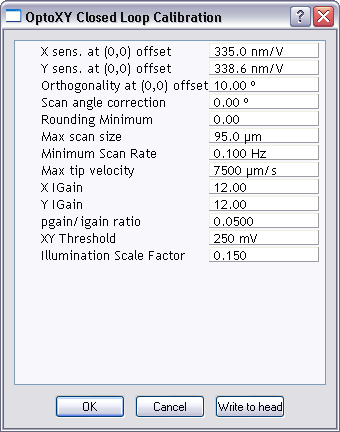
NOTE: When the Dimension Icon scanner is in open loop mode, a different panel, Scanner
Calibration, opens. It shares two of the same parameters
as the OptoXY Closed Loop Calibration panel (Rounding Minimum and Minimum Scan Rate), but includes considerably more calibration parameters to
compensate for piezo nonlinearity
Closed Loop XY Calibration has four procedural components:
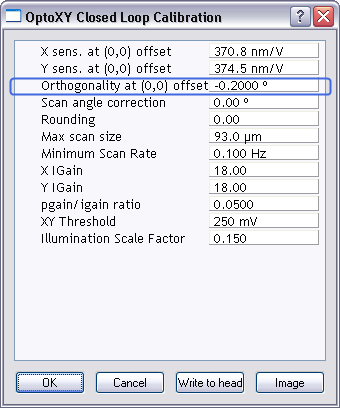
Orthogonality At (0,0) Offset is the deviation from a 90° angle between the scanned X-axis
and Y-axis, positive for an acute angle and negative for an obtuse angle.
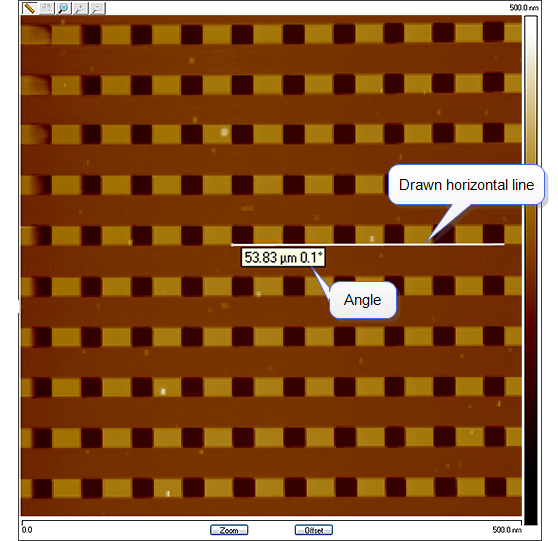
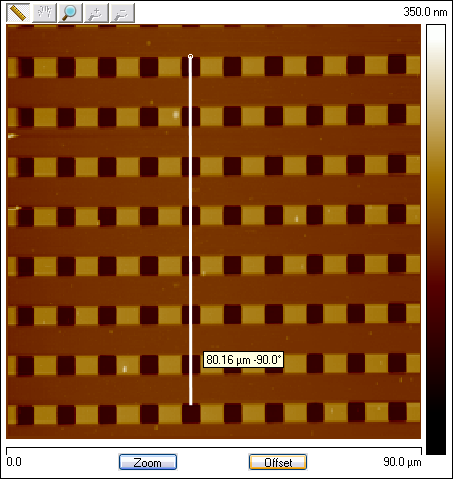
- Capture a 90 μm scan of the calibration reference.
- Enlarge the widow for increased resolution.
- Draw a horizontal line along an edge near the image center as shown below. Note
the displayed angle.
- Draw a vertical line along an edge near the image center as shown below. Note the
displayed angle.
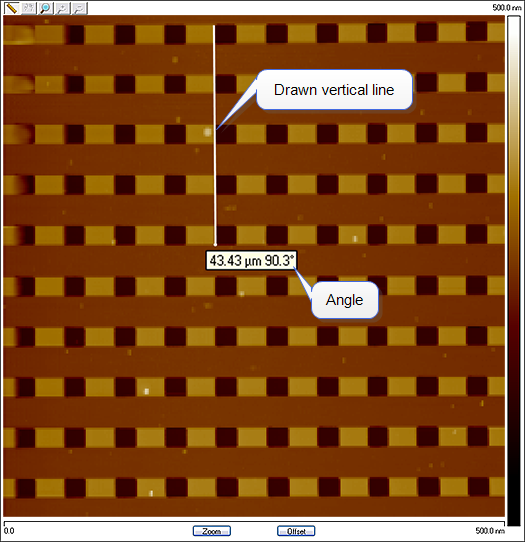
- Perform the following calculation:
- Enter this value into Orthogonality At (0,0) Offset in the OptoXY Closed Loop
Calibration dialog box:
- Set X Offset and Y Offset to 0.
- Verify that the Scan angle is set to 0.00 degrees.
- Engage the surface.
NOTE: Contact Mode is preferable for this procedure because the scan rate is faster
for Contact Mode than TappingMode.
- Select two widely-spaced features on the sample image of known separation. Use the mouse
to draw a horizontal line between them (for example, on a 10 μm silicon
reference, draw the line from the left side of one pit to the left side of another pit as far away
as possible):

The screen will display the measured distance between pits next to the line if the
cursor is near the line.
- Verify that the microscope’s measured distance agrees with the known horizontal distance. If
there is significant disagreement between the two, fine tuning is required; go to the next step.
If the displayed distance agrees with the known distance, skip to Measure Vertically at
90 mm Scan Size.
- Based upon the results in the above step, divide the known distance by the distance displayed
next to the line drawn in step 4:
- Select Calibrate > X-Y. The OptoXY Closed Loop Calibration dialog box displays:
- Multiply the quotient obtained in step 6, above, by the X sens at (0,0) offset value shown on
the OptoXY Closed Loop Calibration dialog box.
- Enter the new value. The new value adjusts the scanner’s fast axis to more closely match
calculated distances with actual feature distances. The new sensitivity setting takes effect as
soon as it is entered.
- To save it to the computer’s hard disk, click OK. This closes the OptoXY Closed Loop
Calibration dialog box.
- Repeat step 4 to check your change.
- Return to the image of the calibration reference.
- Select two features that are widely spaced in the vertical direction and draw a vertical line
connecting like portions of features (top edge-to-top edge, etc.):
The SPM
displays the calculated distance between features.
- Verify that the microscope’s calculated distance agrees with the known vertical distance. If
there is significant disagreement between the two, fine tuning is required; go to the next step.
If the displayed distance agrees with the known distance, no further calibration is required.
- Using the results from the above step, divide the known distance by the distance displayed
next to the line drawn a few steps earlier:
- Select Calibrate > Scanner > X-Y to display the OptoXY Closed Loop Calibration
dialog box.
- Select the Y sens at (0,0) offset parameter.
- Multiply the quotient obtained in step 5, above, by the Y sens at (0,0) offset value shown on
the OptoXY Closed Loop Calibration dialog box.
- Enter the new value to adjust the scanner’s slow axis to more closely match calculated
distances with actual feature distances.
- To save the new parameter value, click OK.
- Repeat step 3 to check your change.
Scan angle correction is an additive adjustment to align the closed loop fast scan axis with the fast scan axis.
To determine the value to enter for Scan Angle Correction:
- Place on the stage a sample containing at least one straight line feature. A two-dimensional
array of repeated features is ideal. No particular alignment of the sample is required to
establish a value for Scan Angle Correction.
- With the CLH in open loop mode, set Scan > Scan Angle to 0° and measure (see note
below) on the display image the angle between the straight line feature and the fast scan axis.
- Withdraw the tip from the sample.
- Toggle Scan > XY Closed Loop from Off to On.
- Re-engage the tip with the sample. Repeat step 2 in closed loop mode, noting the angle
between the chosen sample reference line and the X- (fast scan) axis:
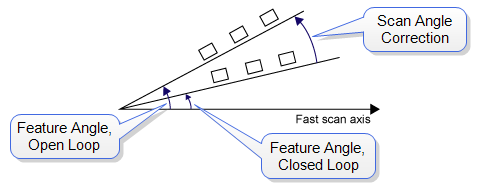
- Enter the difference, angle (closed) – angle (open), illustrated above, as the value in the Scan Angle Correction field of the OptoXY Calibration window.
Other parameters
The remaining parameters in the OptoXY Closed Loop Calibration panel are detailed below.
NOTE: Due to inherent mechanical characteristics of the probe holders used for certain applications (e.g., Fluid Imaging, investigations using the Applications Modules, and Heater Cooler), reduced closed loop X IGain and Y IGain parameters are sometimes necessary. Reduce the closed loop X and Y IGain parameters from their default values when using a probe holder other than the standard air tapping or TR holder. Modified values are given below.
Rounding: Defines the percentage of the fast scan time not captured or shown on the Display
Window. A rounding of 0.1 corresponds to 10% longer scan lines than displayed in the image. This
function allows mechanical systems to stabilize after the scan direction changes. This function
distorts the linearity corrections made on the head or scanner.
- Range and Settings: 0–0.50
NOTE: This parameter should be zero for short, slow scans and increased only for
long, fast scans.
Max Scan Size:A software limit on the largest scan along the fast scan axis.
- Range and Settings: a positive number of micrometers.
- Typical value: 100 μm.
NOTE: Max Scan Size applies only to closed loop operation and is set to 100 μm at
the factory. It is not necessary to ever adjust it. Reducing Max Scan Size
from its default setting restricts scan size. Increasing Max Scan Size from
its default setting cannot damage the scanner and never results in a scan size
larger than is obtained in open loop mode with 440 V (the maximum
allowed) applied across the piezoelectric scan tube. You might increase
Max Scan Size to 110 μm, for instance, if you determine your particular scanner is capable of 110 μm scan size in open loop mode and the extra scan
size is valuable to you. The disadvantage of making this too large is that the
XY feedback loop may reach the edge of the scan or sensor range. If this
occurs, the edge of each line may have several pixels that are all collected at
the same point.
Minimum Scan Rate:Sets a lower limit for the Scan Rate parameter on the
Scan panel.
- Range and Settings: 0.001–10 Hz; default = 0.100 Hz
X IGain:The integral gain for closed loop scanner control along the X-axis (the fast scan axis if the
scan angle is 0°).
- Range and Settings: 0.0625–128
- Default value: 12
- Modified value for specialized probe holders: 8
Y IGain:The integral gain for closed loop scanner control along the Y-axis (the slow scan axis)
- Range and Settings: 0.0625–128
- Default value: 12
- Modified value for specialized probe holders: 8
XY Threshold:The RMS amplitude of high pass filtered X- or Y-scan error signal that is interpreted as
evidence of control loop oscillation, so triggers reducing X IGain or Y IGain to reachieve
control.
- Range and Settings: 0–500 mV
- Typical value: 250 mV; adjust higher as needed.
PGain/IGain Ratio:Proportional gain as a fraction of integral gain, applied to both X and Y axes.
- Range and Settings: 0.05–1.00
- Typical value: 0.05
| www.bruker.com
|
Bruker Corporation |
| www.brukerafmprobes.com
|
112 Robin Hill Rd. |
| nanoscaleworld.bruker-axs.com/nanoscaleworld/
|
Santa Barbara, CA 93117 |
| |
|
| |
Customer Support: (800) 873-9750 |
| |
Copyright 2010, 2011. All Rights Reserved. |
Open topic with navigation
 is
on. These are called the OptoXY Closed Loop Calibration parameters. In addition to the
parameter, XY Closed Loop, in the Scan panel, a new panel, OptoXY Closed Loop Calibration, contains scanner calibration parameters associated with the Dimension Icon scanner.
is
on. These are called the OptoXY Closed Loop Calibration parameters. In addition to the
parameter, XY Closed Loop, in the Scan panel, a new panel, OptoXY Closed Loop Calibration, contains scanner calibration parameters associated with the Dimension Icon scanner.
 Measure Orthogonality at (0,0) offset