Most industrial standards for roughness measurement call for Planefitting data before calculating values. Planefitting applies a temporary first-order planefit before calculating statistics. On many surfaces, especially those which are tilted, this yields different values from those seen in raw (unplanefitted) data. Moreover, peripheral features included within the analyzed region may produce cumulative results uncharacteristic of the feature(s) of interest. To ensure the best results, observe the following rules when using Roughness analysis:
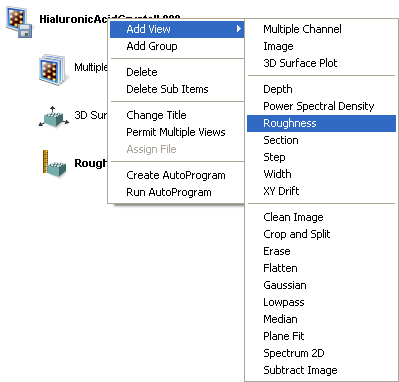
Regarding the effects of Planefitting on Roughness statistics—When Roughness analysis is applied to an image, statistical values are calculated according to the heights of each pixel in the image. Planefitting and Flattening (used to correct images for tilt and bow) reorient these pixels in a manner which can affect roughness statistics dramatically on some surfaces. This is especially true of surfaces having broad, coplanar features. For more information see Plane Fit.
When Roughness analysis is applied to an image or a portion of an image, the data is automatically planefit (first order) beforehand. This is done to accord with ASME and ISO metrological standards. (Only the Raw Mean and Mean parameters are exempt from this operation, being calculated from raw data only.) To avoid unexpected results due to planefitting, be certain to apply Roughness analysis only to the surface(s) of interest by utilizing a cursor box, or by scanning just the specific site of interest. Including peripheral features within an analyzed area may produce cumulative results uncharacteristic of the feature(s) of interest.
Many Roughness results are affected by the OL Planefit parameter that was previously set during image capture. There are three options for this parameter: None, Offset, and Full. The Full option automatically subtracts a first order plane in order to make the average value and the average slope zero. The Offset option subtracts a constant in order to make the average value of the image zero. The None option leaves the data unaltered; thus, the Mean equals the Raw Mean.
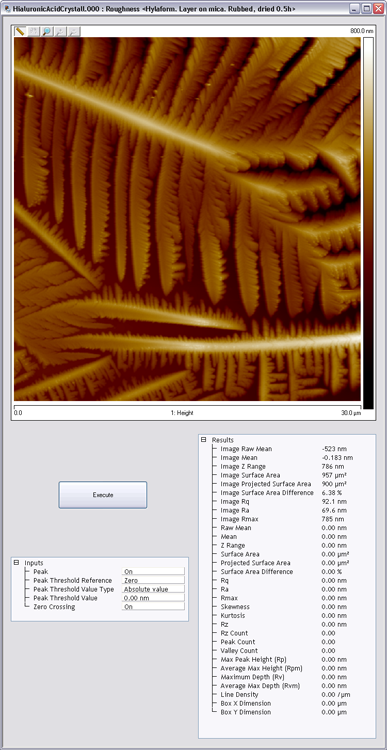
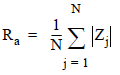
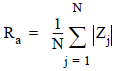
Regarding Basic Roughness Measurements—Average Roughness (Ra) is one of the most commonly used roughness statistics. The figure below, represents two surfaces having the same average roughness.
Figure 1: Roughness Depiction
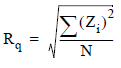
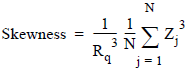
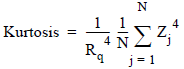
Similarly, a number of other roughness values are based upon least-squares calculations (e.g., RMS roughness, or Rq), and their algorithms are more concerned with a best fit of all height points than with the spatial frequency of features.
The surface of image A is represented as having a high frequency profile of features. Image B represents a separate surface having the same average feature height, but distributed at wider (lower-frequency) intervals. In terms of average and RMS roughness, both surfaces are equally rough. If you are interested in differentiating between the two, you must rely upon other statistical parameters such as Power Spectral Density.
|
Figure 2: Select Roughness from the workspace
Or
Or
Or |
|
![]() |
|
|
The Peak feature, when switched On, isolates specified height portions of the image (peaks) from background data. Peaks are specified using the Peak Threshold parameters, either in terms of their absolute height or their deviation from the RMS value of all surface data, and relative to either the highest data point (Peak) or the mean (Zero). When Peak is turned On, portions of the image contained within the box cursor and falling within the specified boundaries are retained; all other data is removed.
Figure 4: Peak On Input parameters
When Peak is turned On, the following subcommands are activated:
Command | Definition |
---|---|
The Reference buttons select whether the threshold is defined relative to the Zero (lowest) value, or the tallest Peak in the selected region. | |
The Value Type determines whether the threshold is defined as an absolute distance from the reference point in nanometers (Absolute value) or a percentage of the root-mean-square (Rms %) of the Z values. | |
The Value is an absolute distance from the reference point in nanometers (Absolute value) or a percentage of the root-mean-square (Rms %) of the Z values. |
Table 1: Peak On Settings
Parameter | Description |
---|---|
Image Raw Mean |
Mean value of data contained within the whole image, except for stop bands. This is calculated as if the OL Planefit were set to None during image capture. |
Image Mean |
Mean value of data contained within the whole image, except for stop bands. This is calculated after the OL Planefit set during image capture has been applied. |
Image Z Range |
Maximum vertical distance between the highest and lowest data points in the image prior to the planefit. |
Image Surface Area |
The three-dimensional area of the entire image. This value is the sum of the area of all of the triangles formed by three adjacent data points. |
Image Projected Surface Area |
Area of the image rectangle (X x Y). |
Image Surface Area Difference |
Difference between the image’s three-dimensional Surface area and two dimensional projected surface area. |
Image Rq |
Root mean square average of height deviations taken from the mean
image data plane, expressed as:![]() |
Image Ra |
Arithmetic average of the absolute values of the surface height deviations
measured from the mean plane.![]() |
Image Rmax |
Maximum vertical distance between the highest and lowest data points in the image following the planefit. |
Raw Mean |
Mean value of image data within the cursor box you define without application of plane fitting. This is calculated as if the OL Planefit were set to None during image capture. |
Mean |
The average of all the Z values within the enclosed area. The mean can have a negative value because the Z values are measured relative to the Z value when the microscope is engaged. This value is not corrected for tilt in the plane of the data; therefore, plane fitting or flattening the data changes this value. This is calculated after the OL Planefit set during image capture has been applied. |
Z Range |
Peak-to-valley difference in height values within the analyzed region. |
Surface Area |
The three-dimensional area of the region enclosed by the cursor box. This value is the sum of the area of all of the triangles formed by three adjacent data points. |
Projected Surface Area |
Area of the selected data. |
Surface Area Difference |
Difference between the analyzed region’s three-dimensional Surface area and its two-dimensional, footprint area. |
Rq |
This is the standard deviation of the Z values within the box cursor and is
calculated as:![]() where Zi is the current Z value, and N is the number of points within the box cursor. This value is not corrected for tilt in the plane of the data; therefore, plane fitting or flattening the data changes this value. |
Ra |
Arithmetic average of the absolute values of the surface height deviations
measured from the mean plane within the box cursor:![]() |
Rmax |
|
Skewness |
Measures the symmetry of surface data about a mean data profile,
expressed as:![]() where Rq is the Rms roughness. Skewness is a non dimensional quantity which is typically evaluated in terms of positive or negative. Where Skewness is zero, an even distribution of data around the mean data plane is suggested. Where Skewness is strongly non-zero, an asymmetric, onetailed distribution is suggested, such as a flat plane having a small, sharp spike (> 0), or a small, deep pit (< 0). |
Kurtosis |
This is a non-dimensional quantity used to evaluate the shape of data
about a central mean. It is calculated as![]() Graphically, kurtosis indicates whether data are arranged flatly or sharply about the mean. |
Rz |
This is the average difference in height between the (RZ Count value) highest peaks and valleys relative to the Mean Plane. |
Rz Count |
Number of peak/valley pairs that are used to calculate the value Rz. |
Peak Count |
The number of peaks taller than the Threshold Value. |
Valley Count |
The number of valleys shorter than the Threshold Value. |
Max Peak ht (Rp) |
Maximum peak height within the analyzed area with respect to the mean data plane. |
Average Max Height (Rpm) |
Average distance between the (Peak Count value) highest profile points and the mean data plane. |
Maximum Depth (Rv) |
Lowest data point in examined region. |
Average Max Depth (Rvm) |
Average distance between the (Valley Count value) lowest profile points and the mean data plane. |
Line Density |
The number of zero crossings per unit length on the X and Y center lines of the box cursor. A zero crossing is a point where the Z values go through zero regardless of slope. This value is the total number of zero crossings along both the X and Y center lines divided by the sum of the box dimensions. |
Box X Dimension |
The width of the Lx box cursor you define. |
Box Y Dimension |
The length of the Ly box cursor you define. |
www.bruker.com | Bruker Corporation |
www.brukerafmprobes.com | 112 Robin Hill Rd. |
nanoscaleworld.bruker-axs.com/nanoscaleworld/ | Santa Barbara, CA 93117 |
Customer Support: (800) 873-9750 | |
Copyright 2010, 2011. All Rights Reserved. |