You are here: NanoScope Software User Guide > Offline Commands > Display Commands > High Speed Data Capture (HSDC)

High Speed Data Capture (HSDC) Display

High Speed Data Capture files allow for the capturing and storing of many signals.

HSDC Procedure

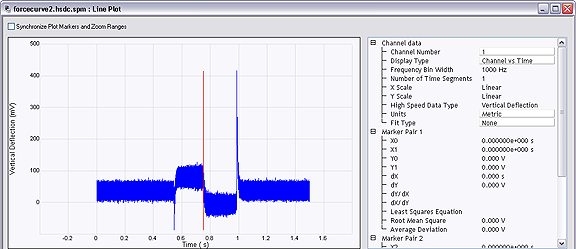
Files created using the High Speed Data Capturefeature can be displayed by double-clicking the file icon (.hsdc file type) in the NanoScope Browse window or by navigating to the preferred file from the Open File icon. This opens a window, shown in Figure 1, that displays the captured data for multiple channels. If the file is indeed an HSDC file, it will be opened in the HSDC window automatically.


To add markers to the HSDC image, position the mouse in the Force Curve graph area to the left of the Y axis. The standard cursor will change to a double-headed arrow cursor. When the double-headed cursor appears, left-click the mouse, and drag the cursor to the desired position on the Force Curve. The data for the position is automatically updated in the Marker Pair Results area.

Figure 1: HSDC Window


In addition to displaying the captured data plotted vs. time, you may also perform a Fast Fourier Transform of the data by changing the Display Type to Amplitude vs Frequency. See Figure 2.

Figure 2: HSDC, Amplitude vs. Frequency

HSDC Interface

Parameter Description
Display Type Choose:

-Channel vs Time or

-Amplitude vs Frequency

Frequency Bin Width Automatically determined
Number of Time Segments Automatically determined
X scale Automatically determined
Y scale Automatically determined
High Speed Data Type Automatically determined
Units Choose: Metric or Volts
Fit Type Choose: None or Line

Table 1: Channel Data Parameters

Parameter Description
Marker Pair 1:  
X0 Z position of first marker, Marker Pair 1
X1 Z position of second marker, Marker Pair 1
Y0 Deflection/oscillation position of first marker, Marker Pair 1
Y1 Deflection/oscillation position of second marker, Marker Pair 1
X1 - X0 Z distance between markers in Marker Pair 1
Y1 - Y0 Deflection/oscillation space between markers in Marker Pair 1
dY/dX Slope of Marker Pair 1
dX/dY 1/Slope of Marker Pair 1
Least Squares Equation  
Root Mean Square  
Average Deviation  
   
Marker Pair 2:  
X2 Z position of first marker, Marker Pair 2
X3 Z position of second marker, Marker Pair 2
Y2 Deflection/oscillation position of first marker, Marker Pair 2
Y3 Deflection/oscillation position of second marker, Marker Pair 2
X3 - X2 Z distance between markers in Marker Pair 2
Y3 - Y2 Deflection/oscillation space between markers in Marker Pair 2
dY/dX Slope of Market Pair 2
dX/dY 1/Slope of Marker Pair 2
Least Squares Equation  
Root Mean Square  
Average Deviation  

Table 2: Marker Pair Results


www.bruker.com Bruker Corporation
www.brukerafmprobes.com 112 Robin Hill Rd.
nanoscaleworld.bruker-axs.com/nanoscaleworld/ Santa Barbara, CA 93117
   
  Customer Support: (800) 873-9750
  Copyright 2010, 2011. All Rights Reserved.