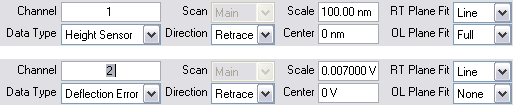
The Channels interface, shown in Figure 1, consists of parameters for each of eight channels. Each channel represents a unique scanning image. Up to eight data Channels may be opened by selecting each channel and choosing a Data Type to view simultaneously. Channels are numbered 1, 2, 3... and feature their own control panels. When a Data Type is selected on a Channel, its image appears. It is possible to have up to eight separate images from each scan. For example, a TappingMode scan might simultaneously present a Height Sensor image on Channel 1, a TM Deflection image on Channel 2, and a Phase image on Channel 3.
Parameters shown on each Channel control panel vary slightly, depending upon the type of microscope selected and operating mode.
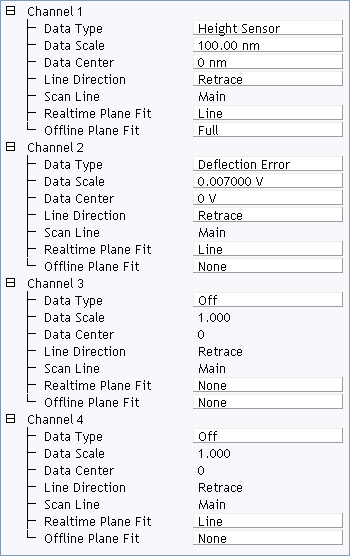
You may access the Channel controls through either the panel below the scope trace of each channel or the Channel panels in the Scan Parameters List , shown in Figure 2.
Figure 1: The Channels interface.
To view the Channels panel as shown in Figure 2, click Experiment > Configure Experiment (see The Configure Experiment window in Scan and Ramp Parameter Lists) > OK or Cancel and then right-click in the Scan Parameter List and select Configure Lists (see Figure 3).
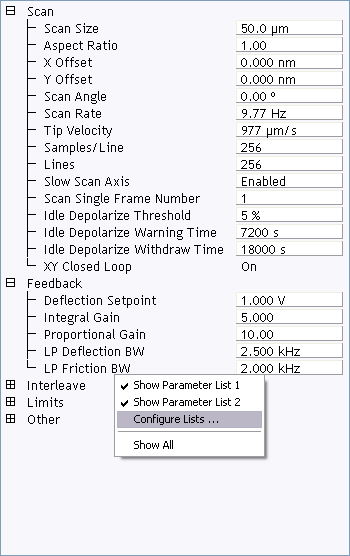
Figure 3: Select Configure Lists
This opens the Panel Lists Configuration window, shown in Figure 4. Drag selected Channels from the Spare List to either Panel List 1 or Panel List 2 (shown) to make them visible. Click Show Parameter List 2(see Figure 3) to make Parameter List 2 visible.
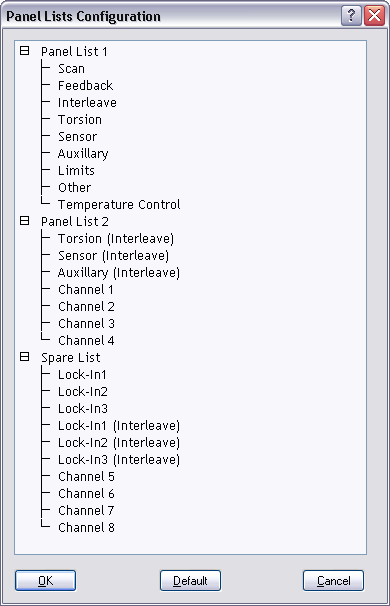
Figure 4: The Panel Lists Configuration window.
| Parameter | Description |
|---|---|
|
Settings vary, depending upon the microscope selected and operating mode as shown in the field descriptions below. The Data Type parameter may receive: no data (Off); sample-height data (Height); cantilever oscillation amplitude data for TappingMode (Amplitude); cantilever deflection data (Deflection); STM current data (Current); phase data (Phase). Range and Settings:
See also Optimizing the Data Type Parameters. |
|
|
The Data Scale controls the Z scale corresponding to the full height of the display and color bar. Range or Settings:
See also Optimizing the Data Scale Parameters. |
|
|
Data center |
Offsets centerline on the color scale by the amount entered. The Data Center offset does not become a permanent part of the data. Range or Settings:
|
|
Selects the direction of the fast scan data collection that is displayed in the image. The feedback calculation is always performed regardless of the scan direction. This parameter simply selects whether the data is collected on the trace or the retrace. This parameter selects the relative motion of the tip to the sample. Range or Settings:
|
|
|
Scan line |
The scan line controls whether data from the Main or Interleave scan line is displayed and captured. Range or Settings:
NOTE: This parameter is not selectable when the Interleave mode parameter is set to Disabled. The system is locked on the Main scan lines whenever the interleaved mode is turned off.
|
|
Applies a software leveling plane to each Real-time image, removing up to first-order tilt and second-order bow. Four types of Plane Fit are available to each Real-time image. Range or Settings:
|
|
|
Offline Plane Fit |
Applies a software “leveling plane” to each captured image for removing up to first-order tilt. Three types of Plane Fit are available to each Offline image. Range or Settings:
See also Optimizing Offline Plane Fit Parameters. |
| www.bruker.com | Bruker Corporation |
| www.brukerafmprobes.com | 112 Robin Hill Rd. |
| nanoscaleworld.bruker-axs.com/nanoscaleworld/ | Santa Barbara, CA 93117 |
| Customer Support: (800) 873-9750 | |
| Copyright 2010, 2011. All Rights Reserved. |