
This manual is © Oxford Instruments and Oxford Plasma Technology.
Issue 5: August 99
Converted to HTML by webmaster Anders Liljeborg

A manual adjustment panel, shown in Diagram 5-5, is located behind a flap in the front of the equipment rack. It comprises:
Auto / Manual switch: Sets the operating mode of the RF matching unit.
C1 Raise / Lower: Manual adjustment of RF matching capacitor C1.
C2 Raise / Lower: Manual adjustment of RF matching capacitor C2.
Capacitor positions for C1 and C2 are displayed as numbers from 000 (minimum) to 999 (maximum).
Note that Diagram 5-5 shows an AMU control panel with control facilities for two AMUs.
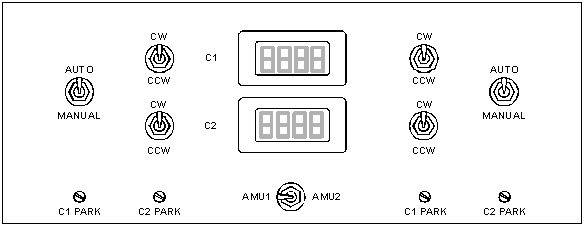
Diagram 5-5: Typical AMU control panel
For full details of the Oxford Instruments Plasma Technology AMU, refer to its Operation and Maintenance manual in Volume 3 of this manual.
The Nitrogen interlock trip level should not usually require adjustment from its factory setting (i.e. Set to trip if the Nitrogen pressure falls to 1 bar). However, if adjustment is necessary, proceed as follows.
NOTE: The interlock is achieved using an IPS-122 indicating pressure switch. Full details of this device are given in the manufacturer’s literature in Volume 3 of this manual.
The pressure switch should be set in the range 1.5 – 2.0 bar gauge.
The rotameter setting depends on the actual gauge pressure of the nitrogen purge, which can be read on the pressure switch. IF this is P bar gauge, then the full scale of the rotameter is:
Full scale = 45 x (1 + P) sccm
For example, if the nitrogen pressure is 2.2 bar gauge, then the full scale of the rotameter (glass ball at the top of the graduated scale) is 45 x (1 +2.2) = 144 sccm.
Different pumps require different amounts of purge gas flow. If details are unavailable, use:
Alcatel pumps: 50 sccm
Pfeiffer pumps: 20 sccm
Leybold pumps: 20 sccm
The rotameter scale is graduated from 0-6. So the inlet pressure is 2.2 bar, 50 sccm would be about one third of full scale (glass float at 2), and 20 sccm would be 14 % of full scale, (glass float just below 1)
As a check, look at the base pressure of the system with and without purge gas flow. There should be no change for systems operating at pressure above 10-7 mbar. IF there is a change, then the purge gas may be too high, the rotary backing pump too small, or the foreline pipe too long and narrow.
While PC 2000 is running, two log files are maintained, one for the system log and the other for the data log. These files are stored on your hard disk in the folder C:\Optsyslg. Details of the log files are as follows.
System log file – The filename for this file is of the form s0Caabb where aa represents the month, e.g. 06 (for June) and bb represents the day of the month, e.g. 11 (for the eleventh day).
Data log file – The filename for this file is of the form p1caabb where aa represents the month, e.g. 06 (for June) and bb represents the day of the month, e.g. 11 (for the eleventh day).
When PC 2000 is shut down correctly (select the System menu, then the Exit option), both log files are automatically saved and closed. If PC 2000 is then started again, the files are automatically opened and their data is available via the System Log page and the Select Log Data page.
If PC 2000 is not shut down correctly, e.g. the PC is switched off or the PC ‘hangs’ etc., one or both of the log files can become corrupted. If this happens, the next time PC 2000 is started the corrupt log file(s) will be detected and reported on-screen by an error dialogue. To correct this problem, use the following procedure:
This sub-section gives functional descriptions of the PC 2000 screens.
The Pump Control page is automatically displayed when PC 2000 is first accessed; the page can also be accessed by selecting the System button, then the Pumping option. A typical Pump Control page is shown in Diagram 5-6. This screen is from an RIE system using an APC, Gate valve, Turbo pump, and backing and roughing valves.

Diagram 5-6: Typical Pump Control page
The Pump Control page provides control and monitoring of the vacuum system. The page has the following features:
|
System status indicators: |
These indicators display the status of the Power Supply Unit (PSU), Hoist, Cooling flowswitch (if fitted), and Gas Pod interlock. PSU: Green when the +15V, -15V and 24V dc supplies are healthy. Red when a supply is faulty. Hoist: Green when the hoist is in its down position (i.e. chamber closed) and Yellow when the hoist is up. Cooling flowswitch: Green when cooling satisfactory. Red when flowswitch is tripped (i.e. cooling flow rate out of tolerance). Gas Pod Interlock: Green when the Gas Pod cover is fitted correctly. Red when the cover is off. |
Vacuum system mimic
The vacuum system mimic is shown in Diagram 5-7.
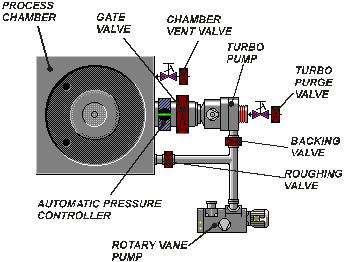
Diagram 5-7: Pump control page vacuum mimic
Valves are coloured Red when closed and Green when open. Running pumps are indicated by animation.
Operator interface
The Pump Control page Buttons, controls, indicators and message panels to allow you to control the vacuum system are shown in Diagram 5-8.
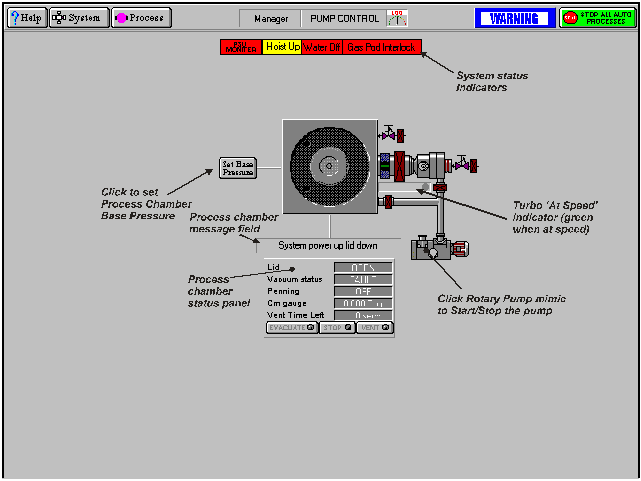
Diagram 5-8: Pump control page operator interface
The operator interface facilities are labelled in Diagram 5-8.
The following facilities are provided:
PSU Monitor indicator – Green when the +15V, -15V and +24V dc PSU outputs are healthy, Red when a PSU output is faulty.
Hoist indicator – Green when chamber hoist is down (i.e. chamber closed), Yellow when hoist is up.
Water Off indicator – Green when cooling water flow is in tolerance, Red when flowswitch is tripped (i.e. no cooling water flow).
Gas Pod Interlock indicator – Green when gas pod cover is correctly fitted, red when the cover is either missing or incorrectly fitted.
The Service Mode page is displayed by selecting the System button, then the Service option.

Diagram 5-9: Service mode page
This page is used during maintenance to manually control system components.
Manual control of the following features is available by clicking on them (confirmation is requested before any action is carried out):
Note that moving the mouse pointer over a feature will cause a box to be displayed around the feature indicating that it can be manually controlled.
The page provides the following facilities:
|
Show Pumps button |
Displays the Pump Control page |
|
Add/Kill Wafer button |
The ADD WAFER button is used to inform the system that a wafer is present. This facility would be used if the machine is powered-up with a wafer in Process chamber. The legend on this button changes to KILL WAFER when a wafer is present, enabling the selected wafer to be removed from system memory. |
The System Data page is accessed by selecting the System button, then the System Data option.

Diagram 5-10: System Data page
The page displays the total usage times of major system components, e.g. RF Generator.
The System Log page is displayed by selecting the System button, then the System Log option.
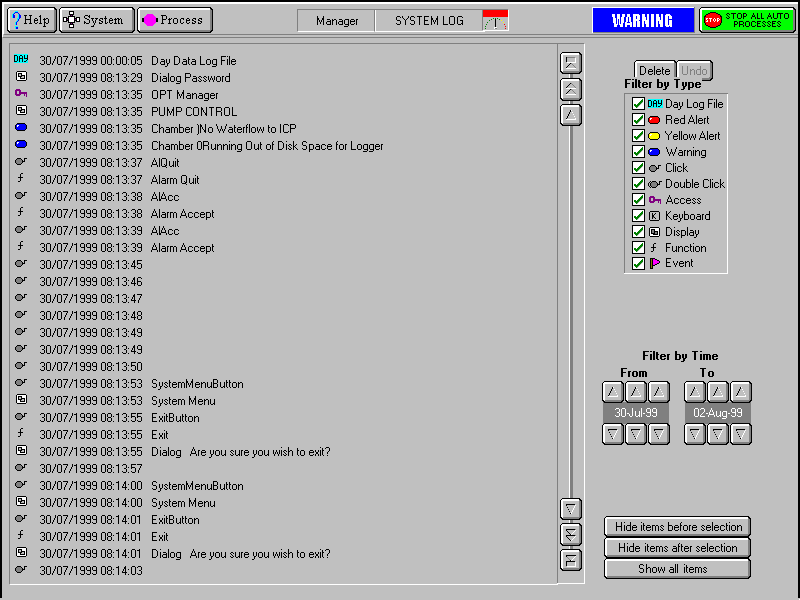
Diagram 5-11: System Log page
The system log page allows logged system events to be viewed. A filter facility allows the viewed events to be displayed by event type and time of occurrence.
The page provides the following features:
|
Event list: |
A scrollable list of events in date/time order. Each event is categorised by an icon, and an event description is given. Use the scrollbar and associated buttons to move the list up or down by a single event, a page of events or to the end of the list. |
|
Delete button |
Removes the selected event(s) from the Event list. |
|
Undo button |
Only active after a Delete action. Restores the last deleted event. |
|
Filter by Event Type panel: |
A list of event types with associated checkboxes. Use this panel to select the events to display in the Event list. A checkbox showing an "x" indicates that the associated event type will not be displayed. A checkbox showing a "3" indicates that the associated event type will be displayed. |
|
Filter by time controls: |
Use these controls to select events occurring in a time range to be displayed.
|
|
Hide events before selection button |
Displays all events after and including the highlighted event. |
|
Hide events after selection button |
Displays all events before and including the highlighted event. |
|
Show all events button: |
Displays all previously hidden events. |
The Recipe page is displayed by selecting the Process button, then the Recipe option.
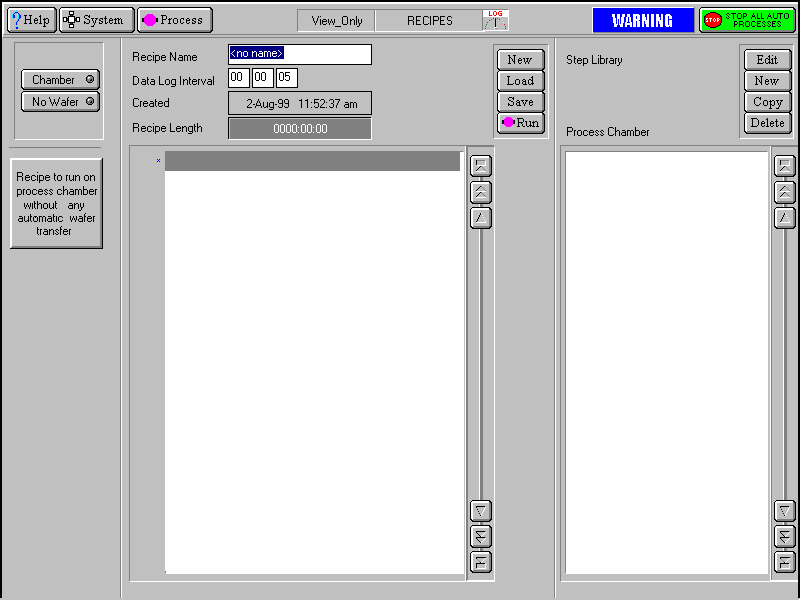
Diagram 5-12: Recipe page
The recipe page is used to create, edit and run recipes. See sub-section 5.7.
The facilities on this page are:
|
Automatic button |
Select to carry out an automatic process run using a recipe. The button’s indicator is coloured yellow when selected. |
|
Manual button |
Select to carry out a manual process run. The button’s indicator is coloured yellow when selected. |
|
Recipe Panel |
|
|
Recipe Name field |
The name of the currently loaded recipe. |
|
Data Log Interval field |
Displays the data log interval, i.e. the time interval between the logging of system parameters. |
|
Created field |
The date and time of recipe creation. |
|
Recipe length field |
The length of time taken to run the recipe. |
|
Recipe step list |
A scrollable sequential list of steps contained in the recipe. |
|
New button |
Select to create a new recipe. |
|
Load button |
Select to load an existing recipe. |
|
Save button |
Select to save the current recipe. |
|
Run button |
Select to run the current recipe. Be aware that selecting this button will cause system components, e.g. valves, heaters, etc., to operate! |
|
Step Library Panel |
|
|
Edit button |
Select to edit the selected (highlighted) recipe step. |
|
New button |
Select to create a new recipe step. |
|
Copy button |
Select to copy the selected recipe (you are prompted for a new step name). |
|
Delete button |
Select to delete the selected (highlighted) recipe. |
|
Step Library list |
Displays the recipe steps available in a scrollable list. |