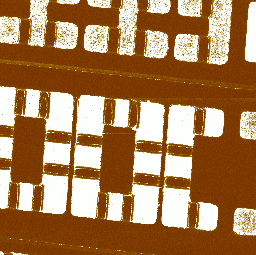
Figure 1: Feedback Bias SCM Image in Closed-Loop Mode
| Parameter | Setting | Adjustment Range |
|---|---|---|
| SCM Igain | 10 | 0–50 |
| SCM Pgain | 10 | 0-50 |
Table 1: Feedback Settings for Closed Loop SCM in the SCM panel
An example of closed loop SCM operation is shown in Figure 1. The less doped areas result in a low signal, while the highly doped areas result in a high signal. In closed loop mode, N-type and P-type semiconductor material result in the same polarity of output signal.
| www.bruker.com | Bruker Corporation |
| www.brukerafmprobes.com | 112 Robin Hill Rd. |
| nanoscaleworld.bruker-axs.com/nanoscaleworld/ | Santa Barbara, CA 93117 |
| Customer Support: (800) 873-9750 | |
| Copyright 2010, 2011. All Rights Reserved. |