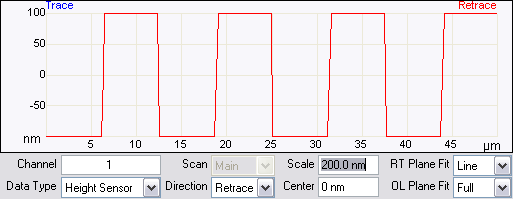
The Scope window, shown in Figure 1, displays a plot of the probe position versus channel data in an oscilloscope-type format.
Measurement cursors for the Scope window are provided to the edges (left, right, top and bottom) of the Grid Display. You can bring a cursor into the grid by placing the mouse cursor outside of the grid, clicking and holding the left mouse button, and dragging it onto the grid.
Right-clicking on the grid will bring up the Grid Parameters menu, shown in Figure 2.
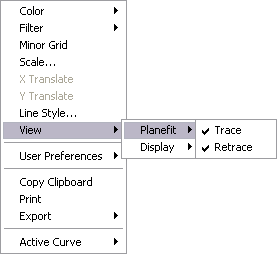
Figure 2: Scope Grid Parameters
The menu options in Table 1 allow you to make the following changes:
| Menu Item | Description |
|---|---|
|
Color |
Allows operator to change color of:
|
|
Filter |
Typically used for a Profiler Scan.
|
|
Minor Grid |
Places a minor grid in the background of the Video window. |
|
Scale |
Allows user to auto scale, set a curve mean, or set their own data range. |
| X Translate | Offsets the curve by placement of horizontal cursor on the grid. Grab the horizontal cursor on the left or right edge of the grid and drag onto the grid. |
| Y Translate | Offsets the curve by placement of vertical cursor on the grid. Grab the vertical cursor above or below the grid and drag onto the grid. |
| Line Style | For each curve, operator can choose, connect, fill down, or point. |
| View |
Planefit
Display
|
| User Preferences |
Restore—Reverts to initial software settings. Save—Saves all changes operator has made during this session. This becomes the new default settings. |
| Copy Clipboard | Copies the grid image to the Microsoft Clipboard. |
| Prints out the current screen view to a physical printer. | |
| Export | Exports data in bitmap, JPEG or XZ data format. |
| Active Curve | Determines which curve you are analyzing. |
| www.bruker.com | Bruker Corporation |
| www.brukerafmprobes.com | 112 Robin Hill Rd. |
| nanoscaleworld.bruker-axs.com/nanoscaleworld/ | Santa Barbara, CA 93117 |
| Customer Support: (800) 873-9750 | |
| Copyright 2010, 2011. All Rights Reserved. |