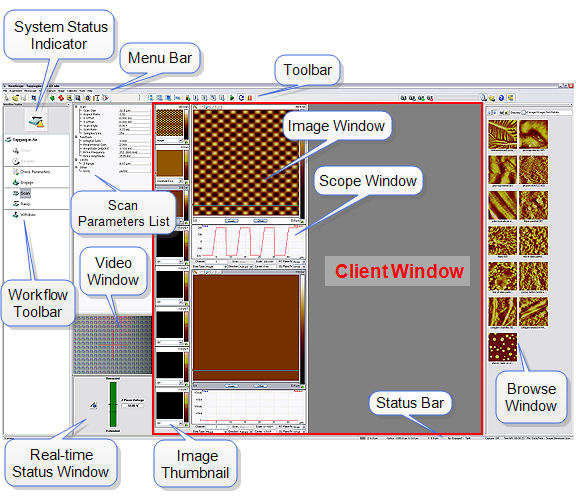
NanoScope version 8 software supports, depending on the microscope, one large (30 in., 2560 x 1600 pixels) single monitor (Dimension Icon, BioScope Catalyst and MultiMode 8) or, in the case of certain older systems, two smaller (19 in., 1280 x 1024 pixels) dual monitors.
The larger area of the single monitor allows for a fixed window configuration, shown in Figure 1.
Because of reduced screen area, the image window in the dual monitor GUI, shown in Figure 2, is smaller and displays at most two channels simultaneously. All windows in the dual monitor GUI may be resized or closed using standard Windows icons.
| The left pane in the NanoScope window. The Workflow Toolbar sequentially organizes the steps (work) needed to perform your experiment. | |
|
Client Window |
A central window for viewing all Realtime and offline graphical displays, input parameters, results parameters and graphs. |
| The Menu Bar | A group of items for executing commands or viewing files. |
| The NanoScope Toolbar | A group of icons for executing commands or viewing dialog boxes to configure input parameters. |
| A list of the available scan parameters | |
| A read only list that displays the stage X, Y, Z coordinates and enabled functions (e.g., Capture: On). | |
| A dockable window in the client window displaying information about the Z piezo position. | |
| A dockable window in the client window for browsing files. Available in list or thumbnail format. | |
| Windows that graphically display the 2D scan results. | |
|
Image Thumbnails |
Highlight a thumbnail to view that channel in the selected image window. |
| Windows that display a real-time plot of the channel signal. | |
| Displays the video camera image.The Video button allows you to turn the video window on and off. | |
| Window that prominently displays the engage status as well as crucial system status information that affects operation. |
Figure 1: NanoScope Version 8 Screen Elements—single monitor
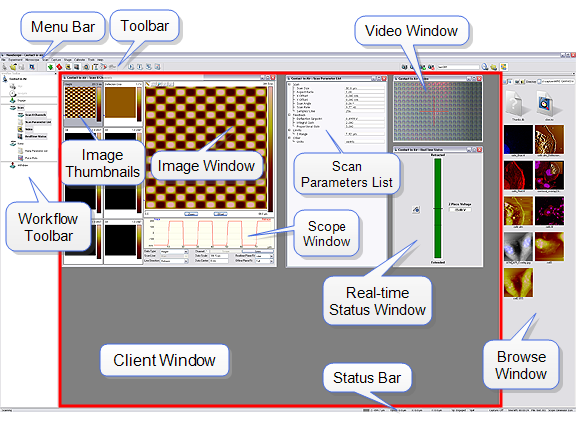
Figure 2: NanoScope Version 8 Screen Elements—dual monitor
| www.bruker.com | Bruker Corporation |
| www.brukerafmprobes.com | 112 Robin Hill Rd. |
| nanoscaleworld.bruker-axs.com/nanoscaleworld/ | Santa Barbara, CA 93117 |
| Customer Support: (800) 873-9750 | |
| Copyright 2010, 2011. All Rights Reserved. |