Short manual for KLA Tencor Profiler
This short-form manual is NOT sufficient to learn
how to use the profiler.
You MUST receive teaching from a responsible
person before using the profiler the first time!
How to export data to text.
This web-manual is more of a memory support when returning to the profiler
after some time.
The profiler is completely computer-controlled via a series of screens (or
layouts).
The first thing you should do is to power on the computer screen.
The last thing you should do is to power OFF the computer screen, to save
it.
Never exit the control program since it is very slow to start again,
many initializations of the profiler.
A breif listing of the different screens would include:
- Recipe selection
- Recipe modification
- Positioning, focus, scan length
- Scan line collection
- Analysis
These screens are here listed in a functional order, which is not neccessary
the order you will find the screens when you work with the profiler.
Usually the first screen you see when powering on the screen is the one below.
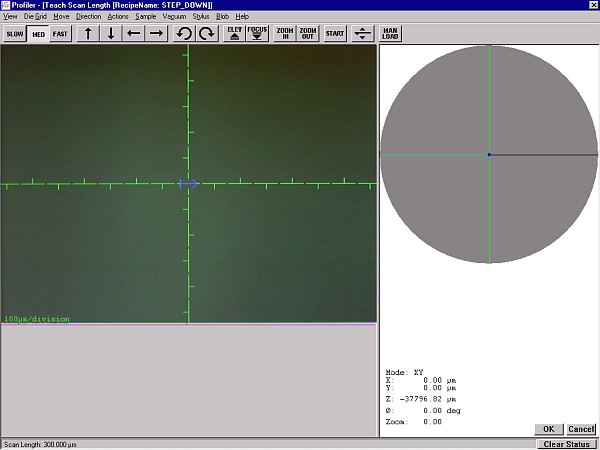
This is where you load your sample, position it and usually start scanning
a profile. The round object to the right is a picture of the circular
sample holder, and the black dot is representing the position of the profiler
sensing tip.
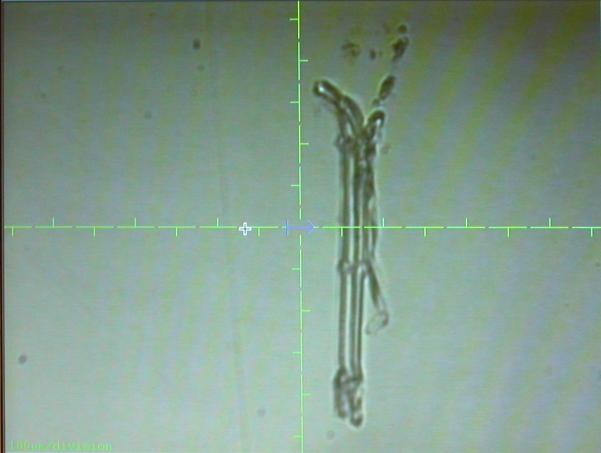
The area to the left, with the tic-marked coordinate system, is also containing
a microscope image of the sample. The length of the central blue arrow
indicates the scan-length set in the current recipe. At start you do not
see much because the scan head is lifted away up from the sample holder
and nothing is in focus.
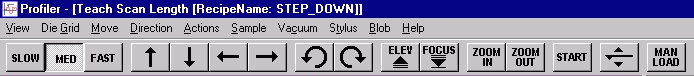
Here are the buttons at the top.
In order to place your sample you first press button MAN LOAD
The sample holder will move to the foremost position, you open the front
window, and place your sample EXACTLY at the center of the circular
sample holder. It has some holes symetrically placed, the center hole is
easily recognized, cover that hole with your sample.
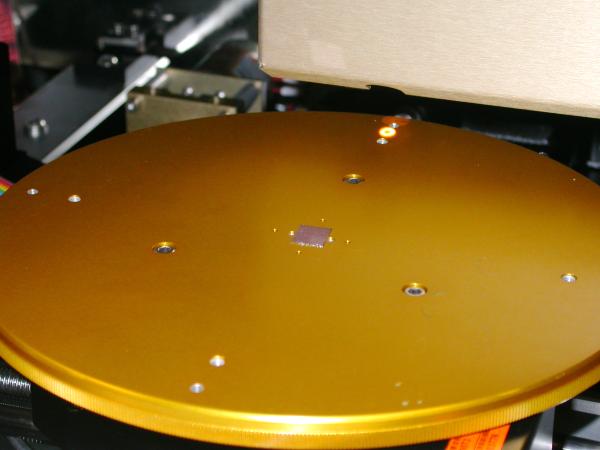
Here the sample holder is in the LOAD position,
closest to the front loading-door. The sample, a small Si-chip, is
positioned at the center.

A close-up of the chip. Note that it is placed at the center of the
drilled holes in the sample holder.
Close the front window.
Press MAN LOAD again, the sample holder will move to the center.
Press FOCUS, this will happen:
-
the microscope image will switch to a side view
of the tip

- the scan-head with the tip will approach the sample
- you will
see the tip land on the sample surface
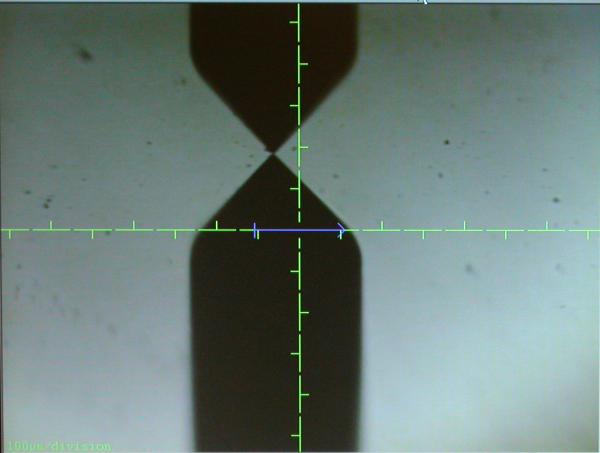
- last the image will switch back to
a top-side view of your sample, here with a scratch suited for measure
resist thickness.
Now you can move around on your sample to position the profile you want to
scan. The SLOW, MED and FAST
buttons decide how much you move per click on the arrow buttons.
Point and click at some point in the image and this point will be
moved to the center of the image.
Please not that this only works if the image is fully ZOOMED
OUT. Use the ZOOM OUT button to set this.
If you point and drag in the image you will define the center
position and the scan length at the same time. The blue arrow
will be set to the length you define.
If you press and hold down one of the arrow buttons, the sample stage will
move faster, and not do a back-lash compensation for each step.
Back-lash compensation looks like a fast back-and-forth movement
at the end of each step.
Position your sample so that the blue arrow falls across the profile
you want to scan.
If you want to modify the current recipe, or select another recipe, click
the Close window button at the upper, right corner. This
will take you to the screen below.
If you want to select another recipe close this window also using the
Close window in the upper right corner.
This will take you to the
Recipe select screen.
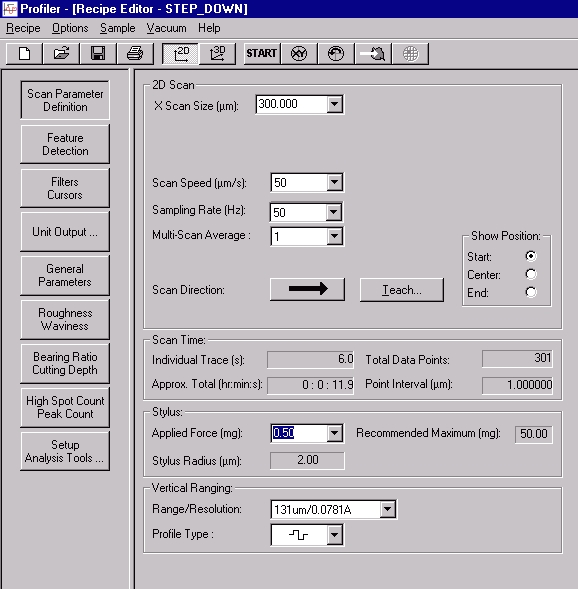
There are many parameters to modify in a recipe, below are the most important
described.
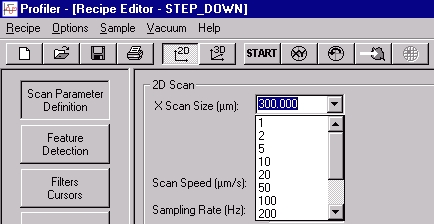
The length of the profile, either choose from the list or type in the
value, in micrometers.
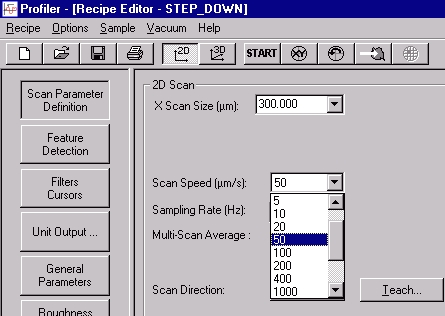
The scan speed, depends on type of sample, how big and abrupt the
surface height changes are. Too slow scan speed makes the scanning
unneccessary time consuming.
Too short makes the profile erronenous, with overshoots at abrupt step-changes
and features missed due to sensing tip not able to trace the surface correctly.
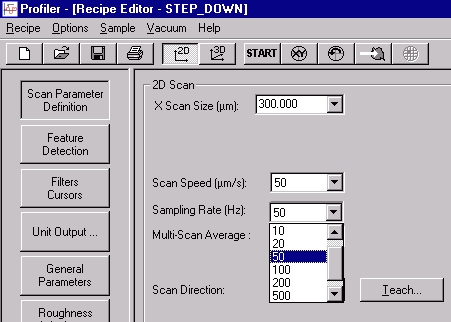
Sampling rate, how often a height value is collected from the sensor.
Depends on the structure of the sample, fine structure requires higher sample
rates at constant scan speed. Higher scan speeds require higher sampling
rate to keep the resolution constant.

Multi-Scan average: same profile is scanned sveral times and an average
in each sample point is computed. Good for average out random noise from
environment. Usually not necessary in our lab.
Note the values computed in the Scan Time: area,
Individual Trace
is the time for one profile in seconds, they are all depending on the
X Scan Size,
Scan Speed and
Sampling Rate in the following way:
            Individual Trace = X Scan Size / Scan Speed
           Total Data Points = Sampling Rate / Scan Speed × X Scan Size
              Point Interval = Scan Speed / Sampling Rate
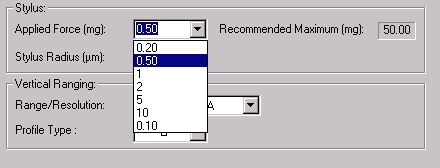
Applied force: the force with which the sensor tip is pressing against the
sample. Can make the tip follow the sample better at higher scan speeds.
May damage the tip if used excessively. May also scratch the sample if
surface is soft enough.
For resist thickness measurements
it is usually sufficient with 0.2 or 0.5 mg.

Range/Resolution: If you know roughly how large height variations there
are on your sample you can set this parameter accordingly. The
Range value means the total amount of height variation
that is acceptable during the scan before saturation of the height sensor.
If the sample has an overall slant this will affect the setting.
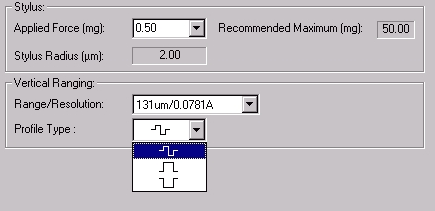
Profile type: What you expect the sample to be like:
- Both up-going and down-going flanks
- Large low area with a few mesas or hills
- Large high area with some depressions or valleys
For smallest Range / highest resolution only the first alternative is
available.
Start the scan
When all parameters of the recipe is set to your liking, move to the
Load / Teach Scan Length screen by pressing the
 button. You will now have the screen below.

Make sure your are at the right position to start the scan, then press
the START button. The microscope image will switch to sideways
view of the tip and the scan will start.
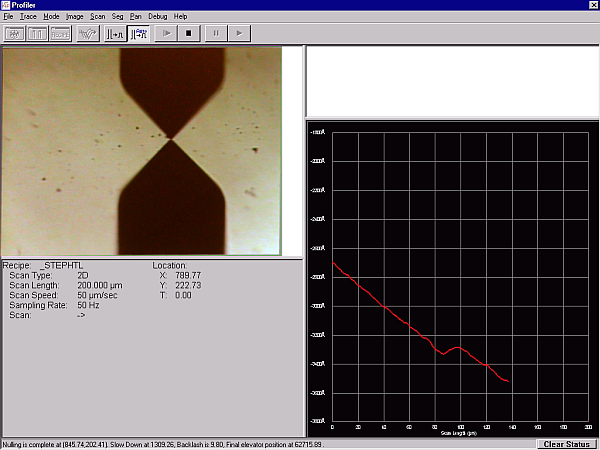
To the right the profile will grow as the scan is collected. The profile
is slanted since the sample always has some overall slant.
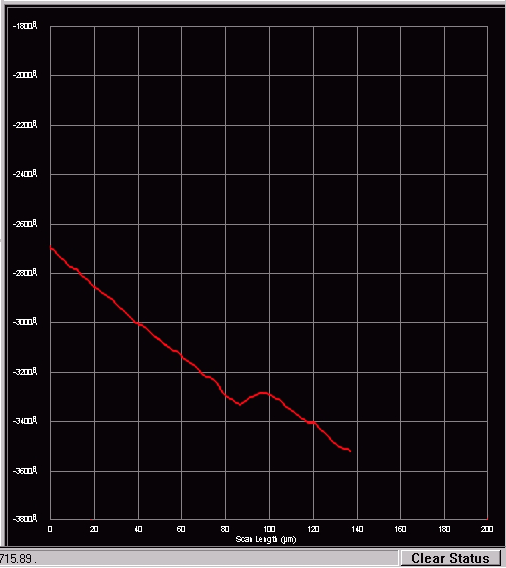
Here is a full-resolution image of the "Live scan area". If the
scan-line slants outside of the top or bottom of the diagram it is auto-scaled
to contain the profile. This works up to the maximum
Range/Resolution parameter set earlier in the recipe.
When the scan is finished the screen is automatically changed to
Analysis.
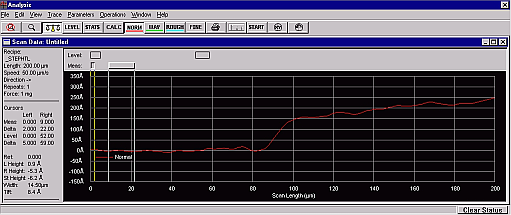
Here the collected profile is displayed with perhaps a rough levelling.
When the Analysis screen is shown first, it defaults to
Measurement cursors being active. First thing to do is to
properly level the profile. Activate the Levelling cursors
by pressing the
 button.
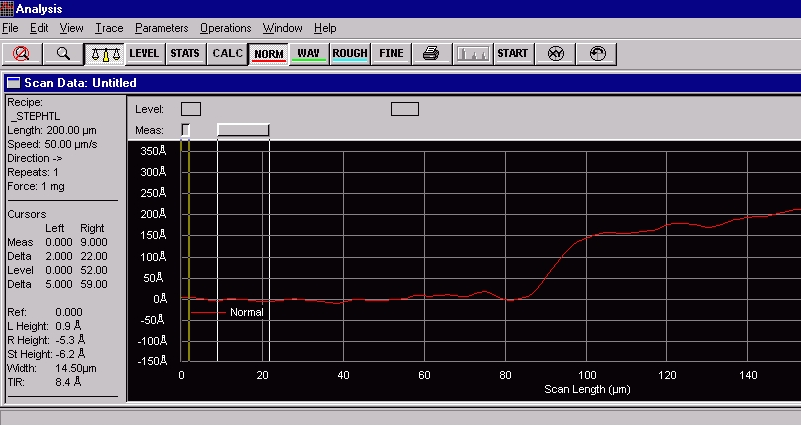
Now the two Level cursors are active, just below top frame
of the Scan Data window. The cursors can be moved by the
track ball and clicking/pressing the left button. As you see the cursors
has a width in which the mean height value is computed and used for levelling.
The levelling is performed by placing the two cursor mean values on the same
level.
I find it easier to move the cursors with the keyboard arrow buttons:
- left / right moves the active cursor
- up / down : widens / shrinks the active cursor
- space bar toggles between left cursor - right cursor - both cursors
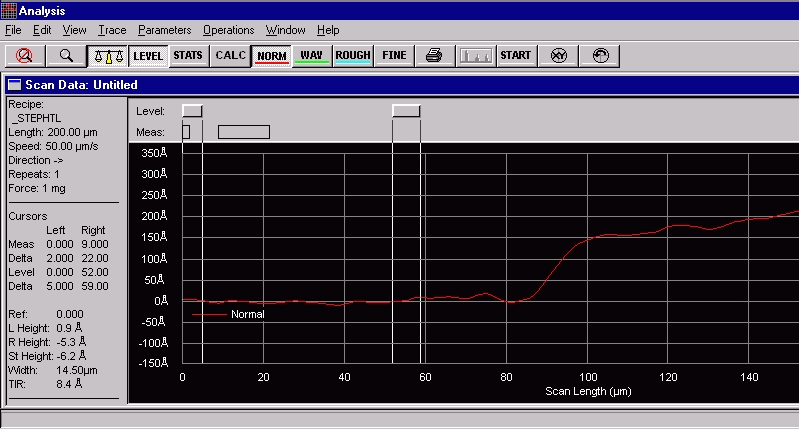
When the two cursors are satisfactory positioned, in this case at the far left,
and just before the raising slope, the
button is pressed again, and the levelling is carried out.
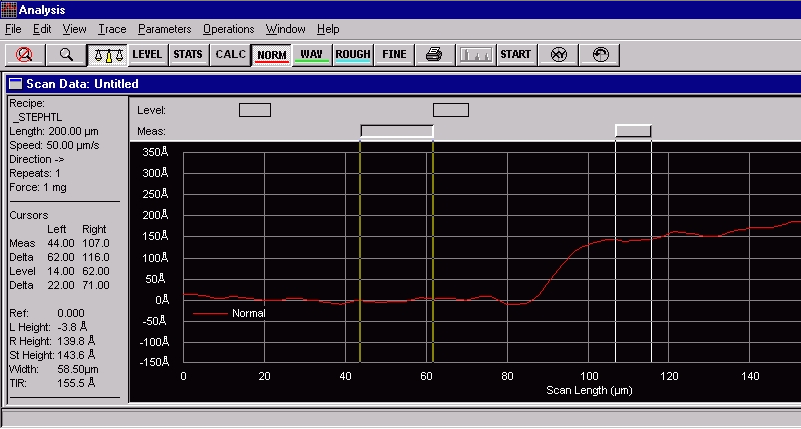
Now the step height can be measured by placing the Meas
cursors in correct positions. They are manipulated in the same way as the
levelling cursors. You can read the step height to the left in the
Cursors area, in this case
St height: 143.6 Å.
Recipe selection
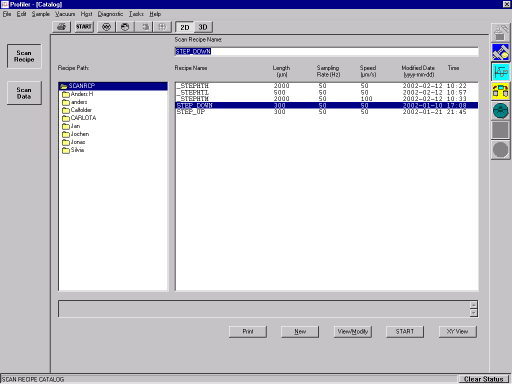
To get to this Recipe Selection Catalog screen, you have to
close the Recipe Editor with the usual close button at the
top right corner. Then you will come to this screen.
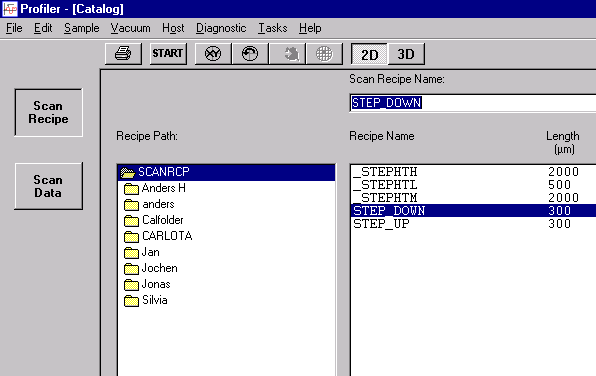
Each user has their own folder to store recipes. Select one and click the
View/Modify button to check or change parameters of the
recipe.
There are also some standard recipes in the top level folder
which can act as starting points for recipes.

The buttons at the bottom of this screen can START the scan
immediately if you have already set the start position is correctly.
The XY View button will switch to the screen
with microscope image and positioning buttons. The other buttons I assume
are self-explanatroy.
Here are the buttons to change working mode of the profiler.
Anders Liljeborg
Nanostructure Physics
KTH
