- Right-click on the name of the image in your workspace. Choose Add View > Flatten from the pop-up menu, select Modify > Flatten from the menu bar, or click the Flatten icon on the toolbar.
The Flatten filter can be used to remove image artifacts due to vertical (Z) scanner drift, image bow, skips, and anything else that may have resulted in a vertical offset between scan lines. Refer to Flatten for details.
- Set the input parameters for the filter. For example, you can choose the order of the polynomial to use to fit scan lines.
- Click Execute.
- To restore to the original data, click Reload. Then change the parameters and click Execute again.
- Right-click on the name of the image in your workspace again. Choose Add View > Section from the pop-up menu, select Analysis > Section from the menu bar, or click the Section icon on the toolbar. Section analysis allows you to easily make depth, height, width, and angular measurements.
Section analysis allows you to easily make depth, height, width, and angular measurements. Refer to Section for details.
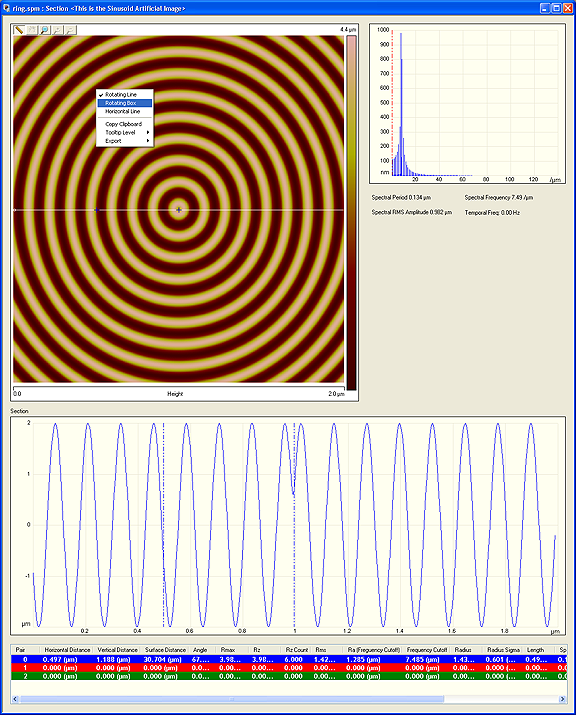
- Drag a line across the image. A vertical cross section along that line is shown in the upper graph area, shown in Figure 1. The right graph, also shown in Figure 1, shows the power spectrum (Fourier Transform) of the cross section.
- In the lower (Section) graph, drag the two cursors around to make measurements. You can grab two or more measurement cursors from the outside of the grid. You will see the cursor change to a
 , at which point you can grab the measurement cursors. The results area at the bottom of the view shows various measurements at the marker position.
 - Section can have three horizontal lines or 3 rotating lines or one rotating box. It can have three sets of grid markers on one image cursor or one set of grid markers on each image cursor.
- If you would like to make an Average Section, right-click on the image, select Rotating Box. After drawing the box, you can make it rotate by holding down the shift key while grabbing anywhere in the box.