
The Workflow Toolbar, shown in Figure 1, provides you with the steps, sequentially ordered, to run your experiment.
Figure 1: The Workflow Toolbar.
Workflow Toolbar items are briefly described in Table 1. Active function names are highlighted in the Workflow Toolbar.
|
|
System Status Indicator | The System Status Indicator displays information about the engage status of the probe as well as crucial system status information that affects operation. |
|
|
Experiment |
The name of the type of experiment that you have selected. The icon displayed is a function of the experiment chosen. |
|
|
Setup |
Opens the Setup window, described in Setup View. |
|
|
Navigate |
Opens the Navigate window, described in Navigate View. |
|
|
Check Parameters | Opens the Check Initial Scan Parameters view. |
|
|
Tune |
Opens the Tune window, described in Cantilever Tune. |
|
|
Engage |
The Engage command brings the tip into contact with the sample surface and starts the Real-time imaging process. |
|
|
Scan |
Scans the probe tip over the sample, producing an image. Additional information can be found in Views for Scanning. |
|
|
Ramp |
Opens the Ramp Parameter List, the ramp plots window and, if requested, the ramp controls window. Additional information can be found in Ramp Panel. |
|
|
Force Volume |
Opens the Force Volume Parameter List and the Force Volume GUI. Additional information can be found in . |
|
|
Withdraw |
The Withdraw command stops the scanning process and withdraws the tip from the surface. |
|
|
Generic Sweep |
Opens the Generic Sweep window, described in NanoScope V Controller Lock-In. |
Table 1: NanoScope Workflow Toolbar menu
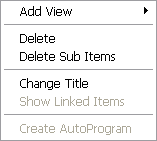
The Functions menu, shown in Figure 2, is accessed by right-clicking on a parent node (i.e., Scan, Ramp or a filename). It includes specific elements for viewing multiple windows, renaming views, grouping views, and adding and deleting views. This menu also includes the command for running an Auto Program (i.e., Run AutoProgram) where the image processing commands may be run in a series on multiple images and results may be saved in a data file.
|
Add View |
Accesses a submenu of Realtime or offline commands. Refer to Workflow Toolbar Commands for details. |
|
Delete |
Deletes the currently selected node in the workspace. If changes were made, a prompt appears to save the view. |
|
Delete Sub Items |
Deletes the items listed under the currently selected node in the workspace. If changes were made, a prompt appears to save the view. |
|
Change Title |
Allows for the selected view title to be changed. |
|
Show Linked Items |
|
|
Create AutoProgram |
Allows you to create a new Auto Program based on analysis done on a node. Refer to Creating an AutoProgram for details. |
|
Edit AP Attributes |
If the currently selected node is in Auto Program, this parameter allows you to edit the Auto Program properties. |
|
Run Auto Program |
Accesses the Auto Program Results view to run the selected image processing commands. |
The Functions submenu allows for adding new views to the workspace in the Add View command (see Figure 3).
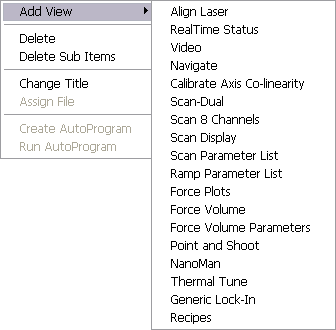
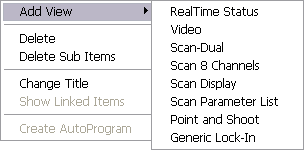
Figure 4: Scan Workspace Functions Submenu
The Add View submenu includes commands for running the microscope, analyzing and reporting. Selecting a command adds the item name and icon as a new child node to the workspace window. Click on a node to invoke the view in the client window.
Depending upon the microscope type and mode (i.e., Realtime and Image Processing), each workspace has unique commands in the Add View submenu. For the Realtime functions Add View submenu, see Figure 4. For more detailed descriptions about the views, see Real-time Views.
| www.bruker.com | Bruker Corporation |
| www.brukerafmprobes.com | 112 Robin Hill Rd. |
| nanoscaleworld.bruker-axs.com/nanoscaleworld/ | Santa Barbara, CA 93117 |
| Customer Support: (800) 873-9750 | |
| Copyright 2010, 2011. All Rights Reserved. |